San Francisco Real Estate Market Report – April 2021
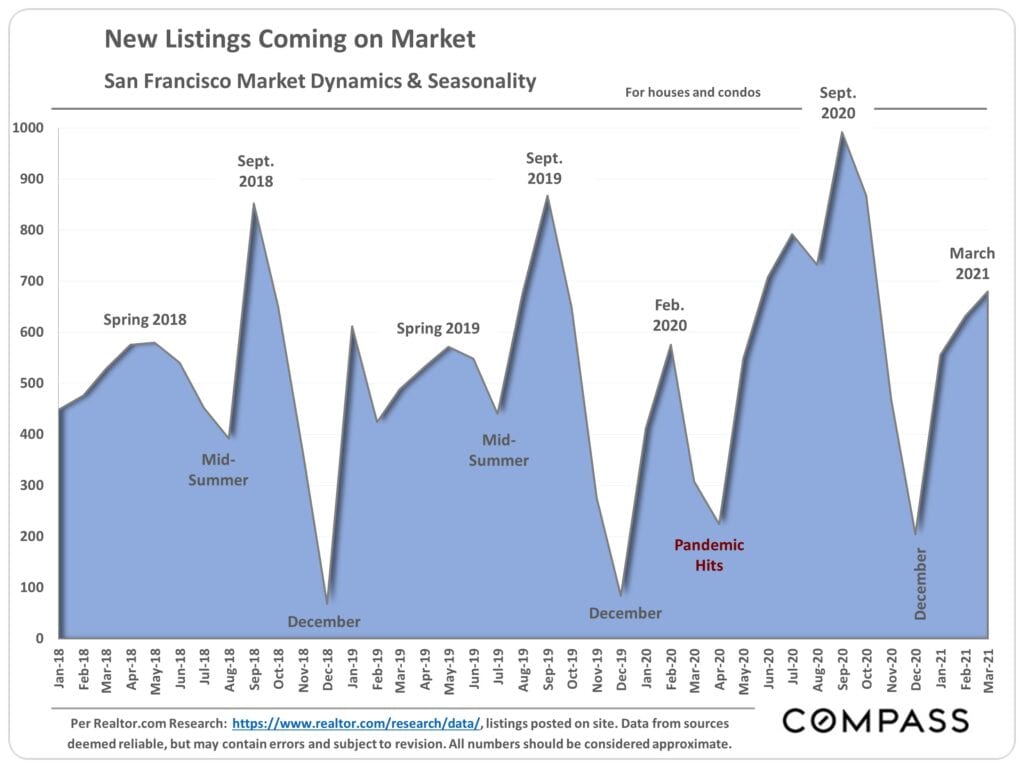
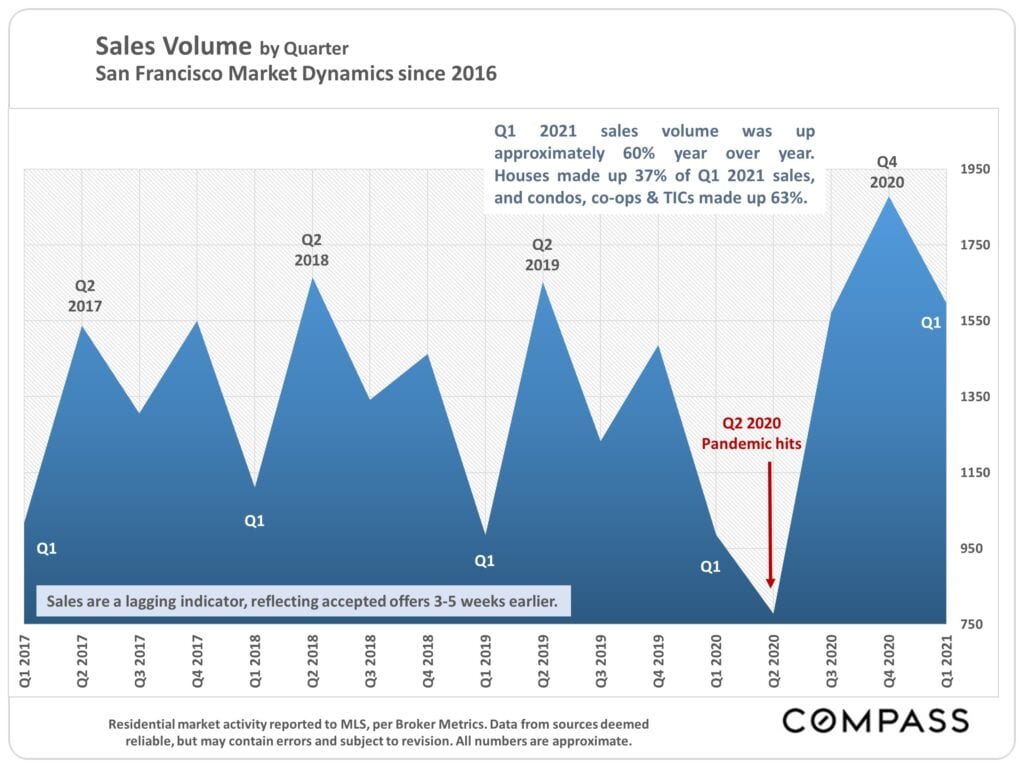
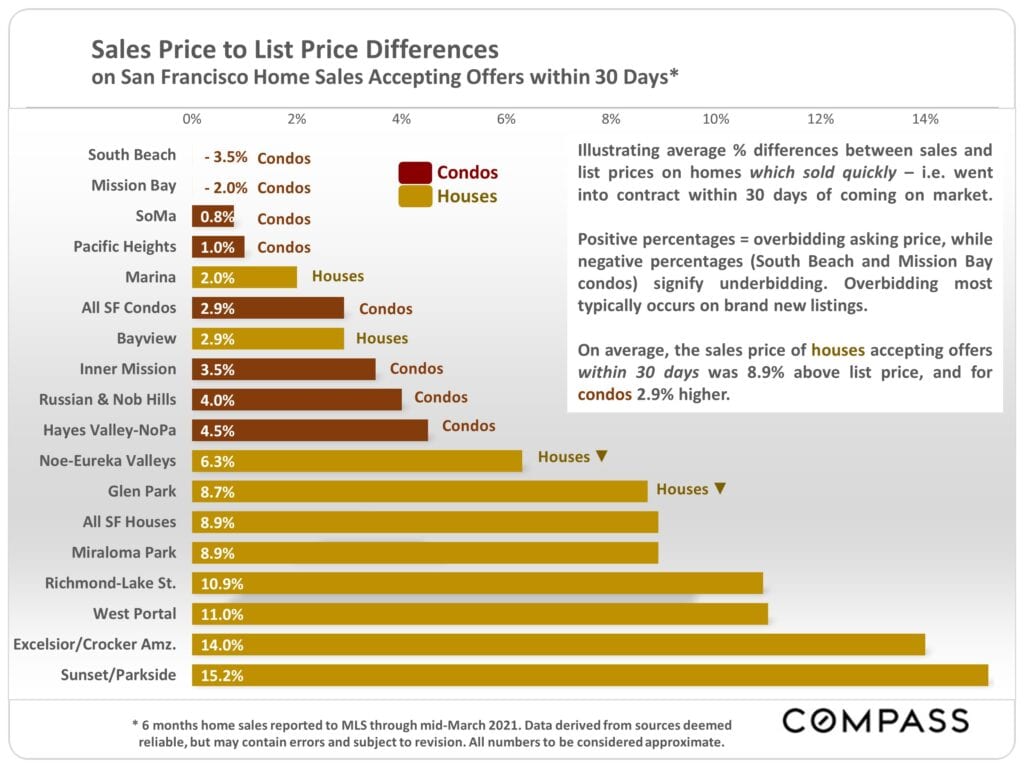
Q1 is typically a slow quarter, its sales and sales prices mostly reflecting activity during the mid-winter holiday “doldrums”, as the market gradually wakes up in the new year. But business went crazy this past winter – sales peaked for the year in Q4 – and first quarter activity was far higher than Q1 2020.
Interest rates, through still extremely low by historical standards, have climbed 20% since their all-time low in January.
Highlights:
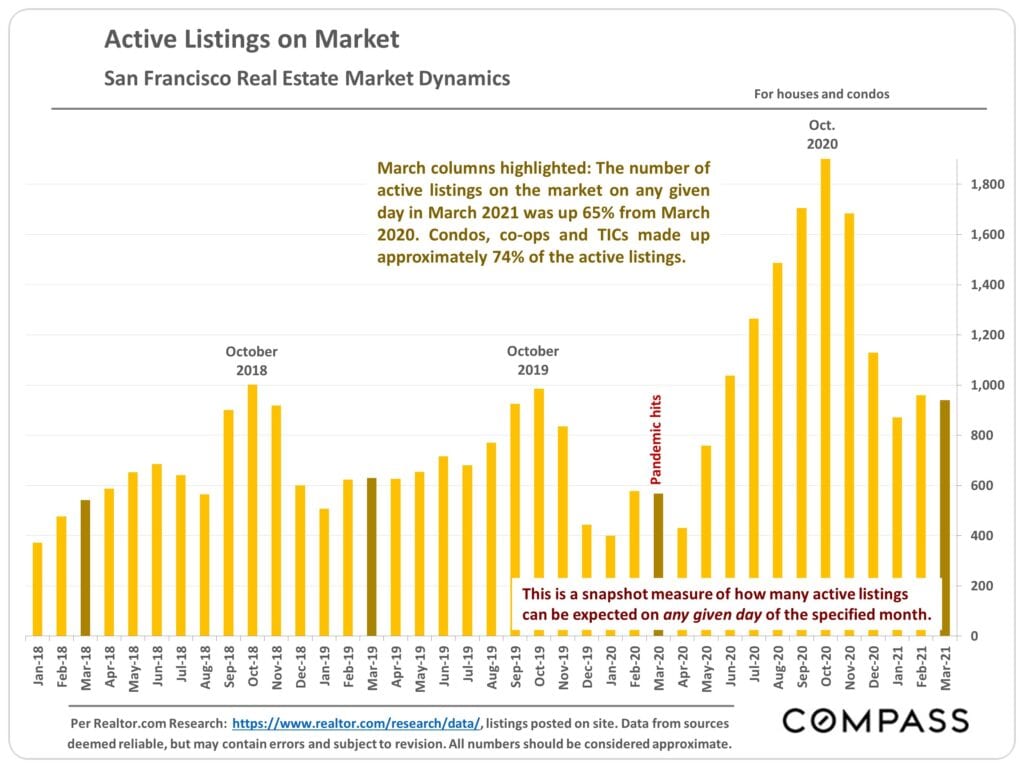
- The number of active listings on market has fallen from the pandemic-induced highs but active listings are still far above our normal rate for this time period. The current volume of active listings is more inline with historic Q4 numbers.
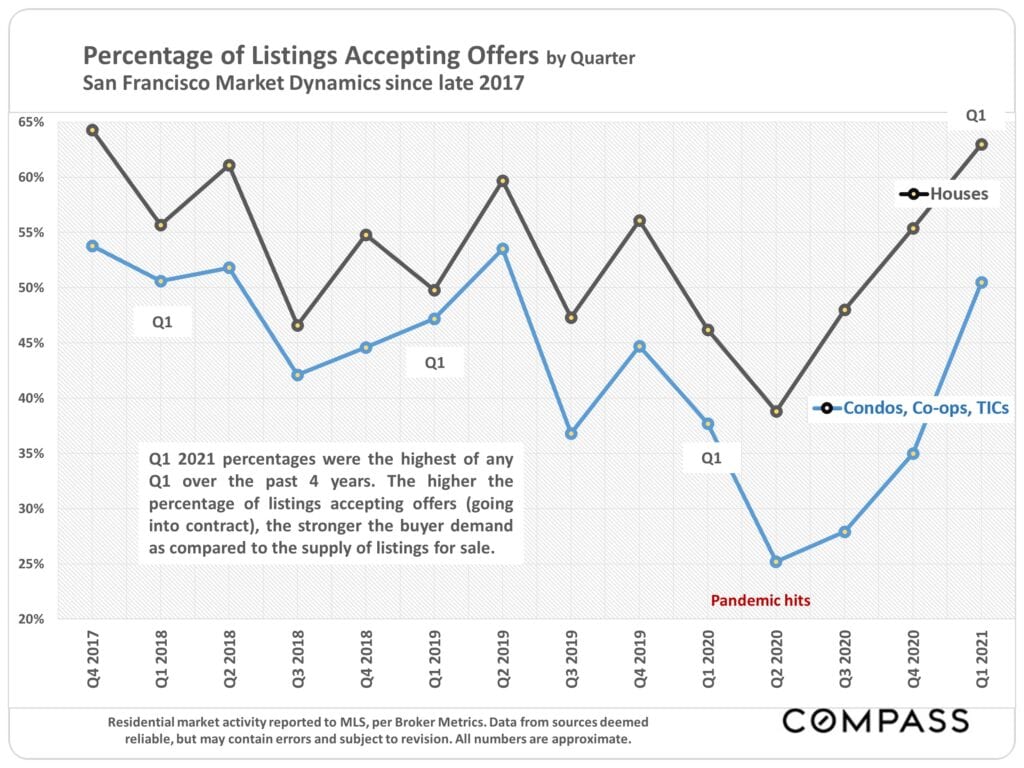
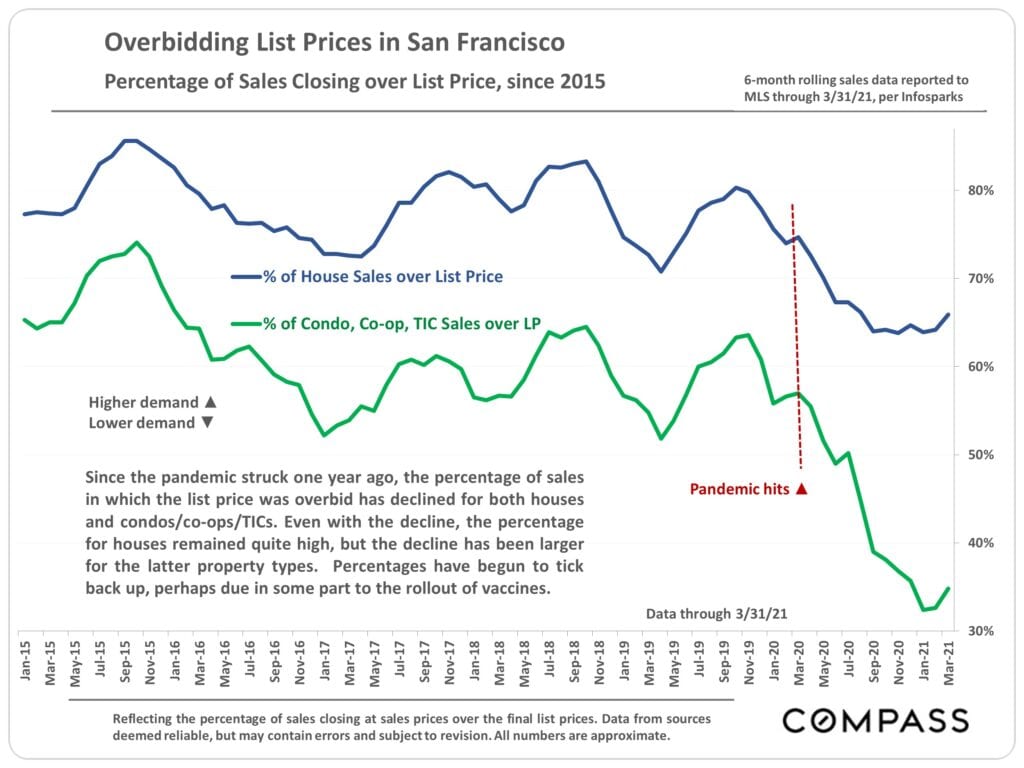
- The percentage of listings accepting offers continues a rebound that began in Q2 2020. The higher the percentage of listings going into contract, the stronger the buyer demand vs the supply of listings for sale.
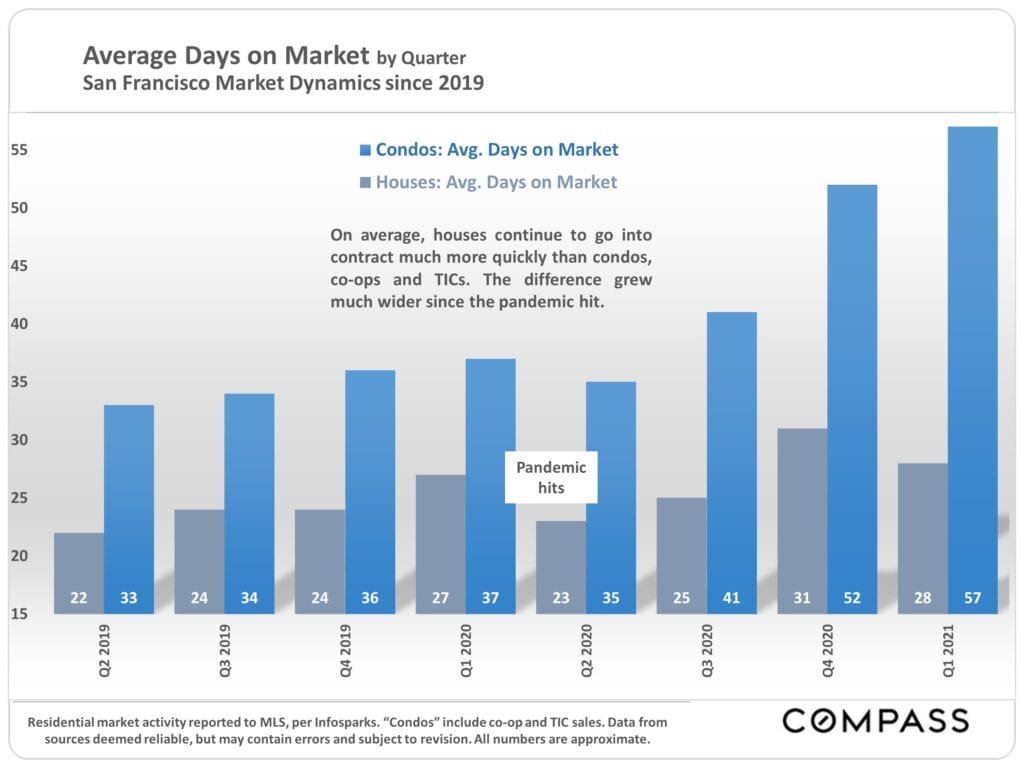
- Average days on market for condos continues to increase and now stands at 57 days. The historic average is 35 days.
Q1 2021 vs. Q1 2020, Selected Statistics
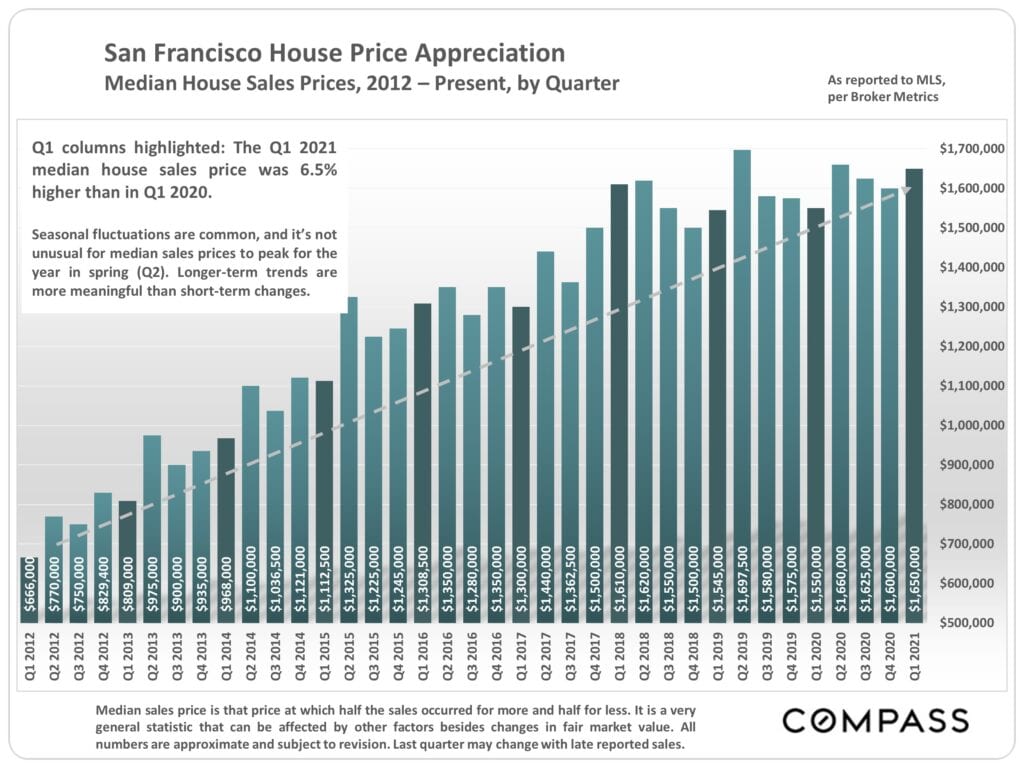
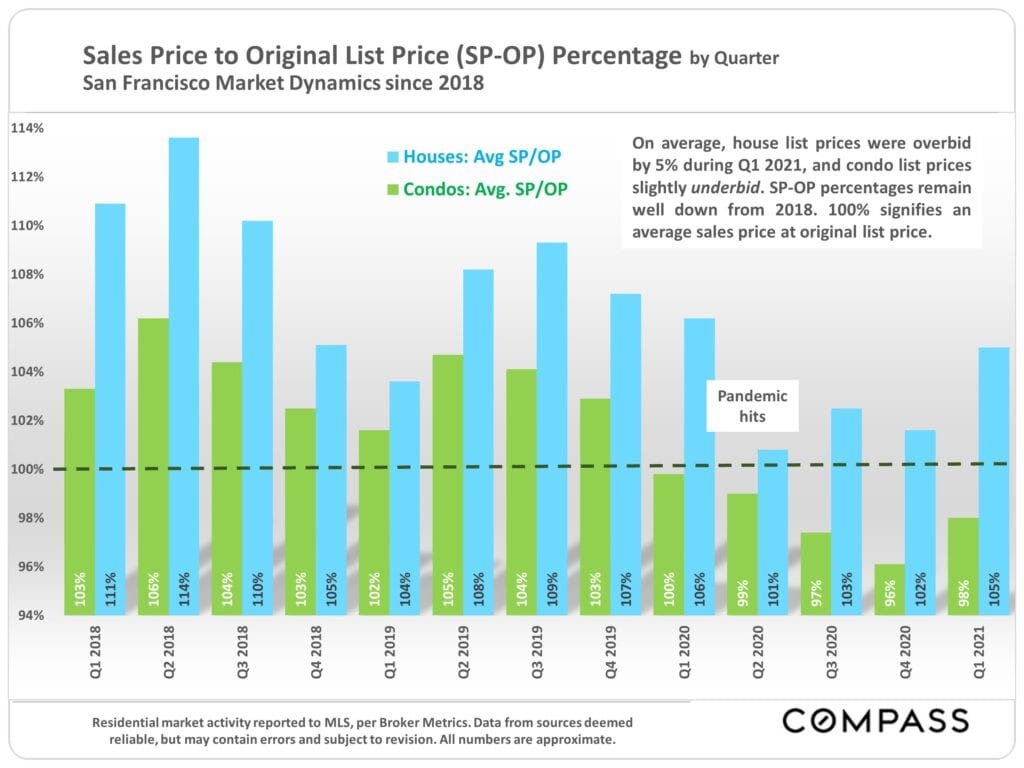
- Median house sales price up 6.5%
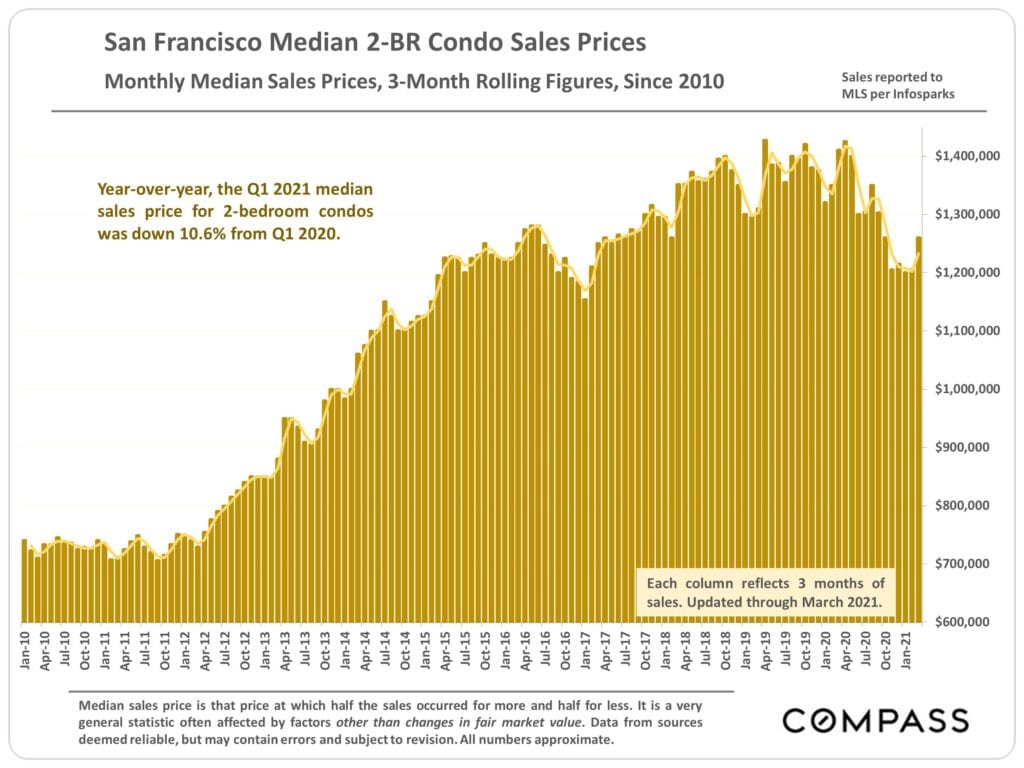
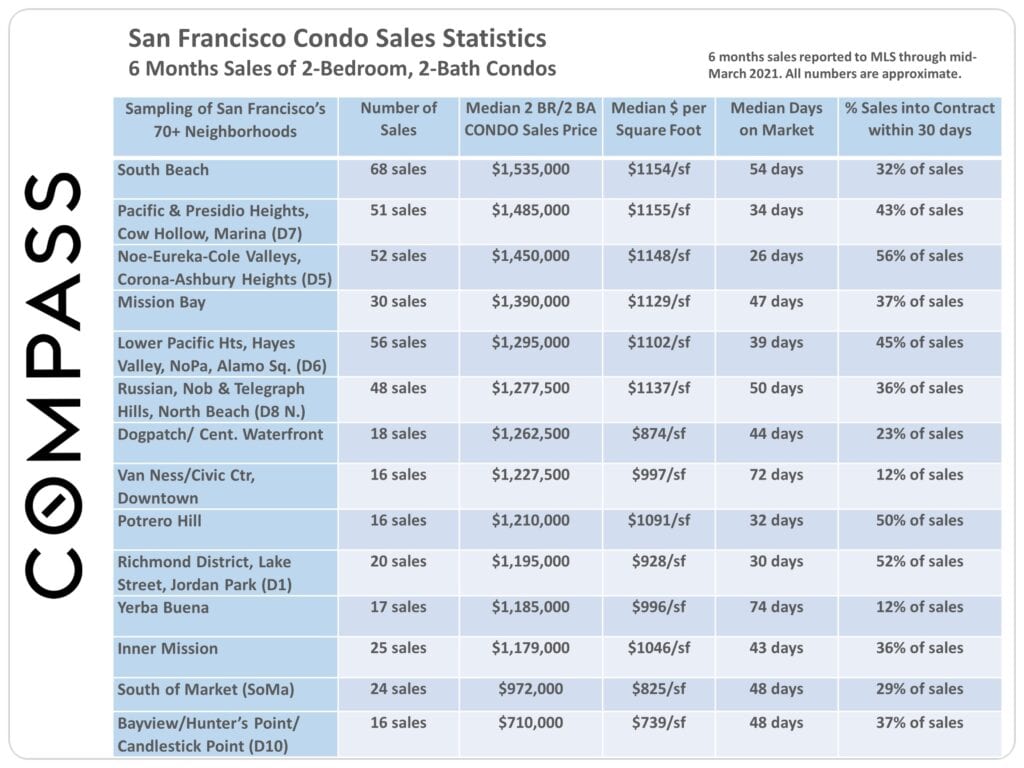
- Median 2-bedroom condo price down 10.6%
- Home sales volume up 60%
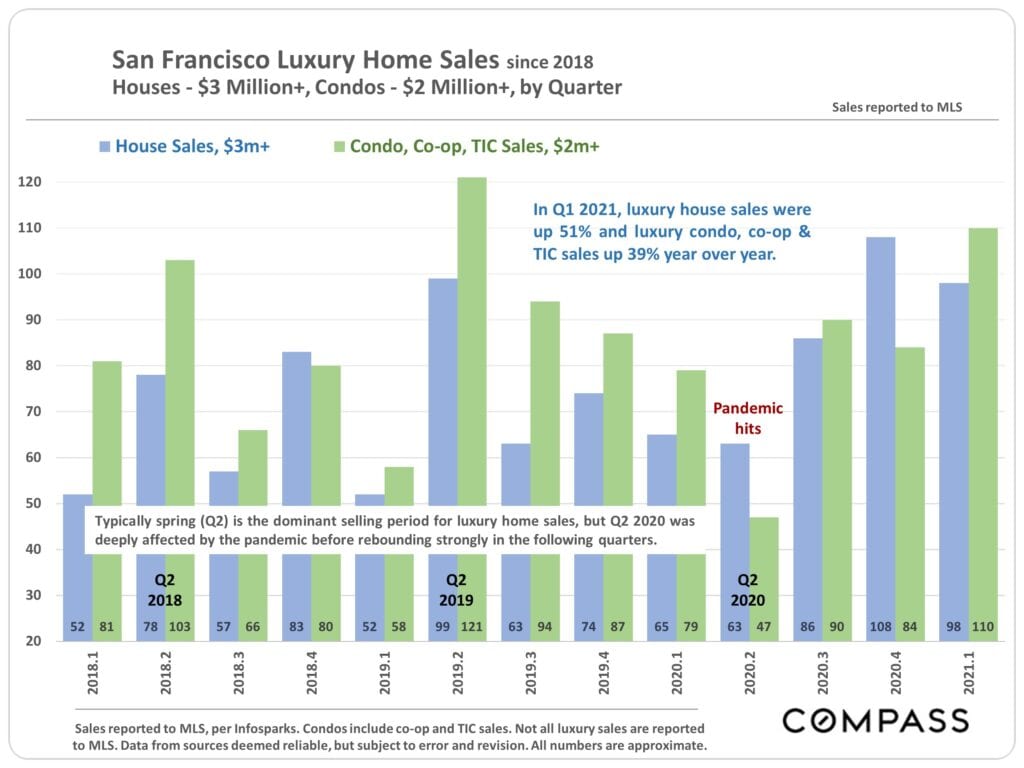
- Luxury house sales up 51%
- Luxury condo sales up 39%
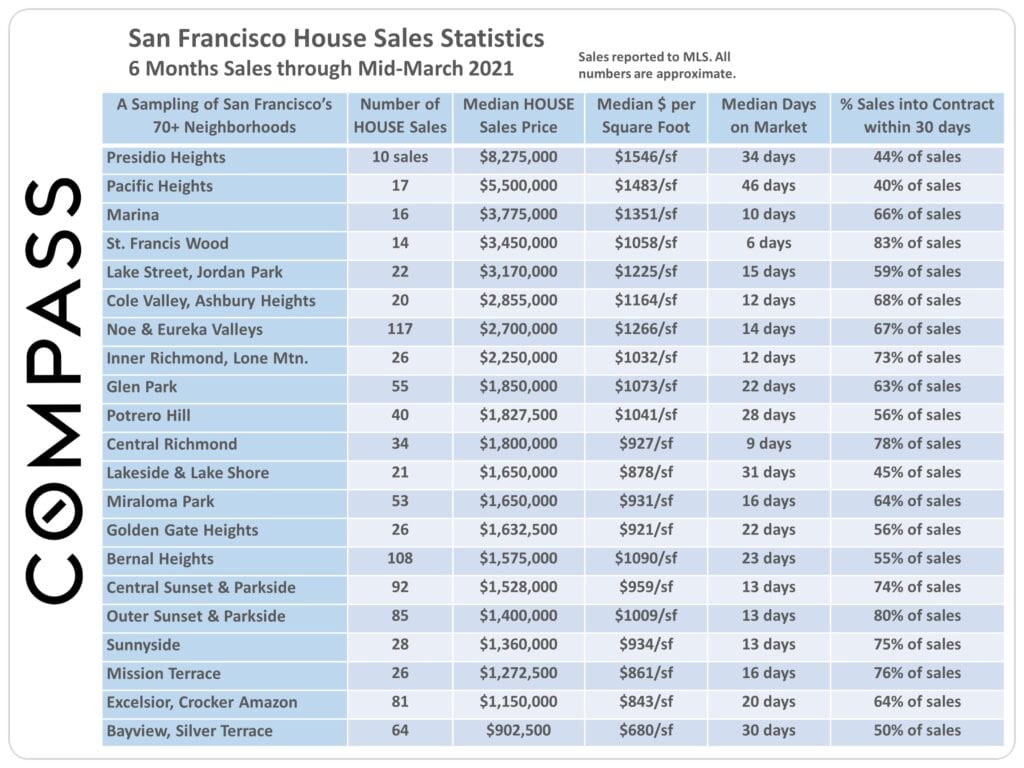
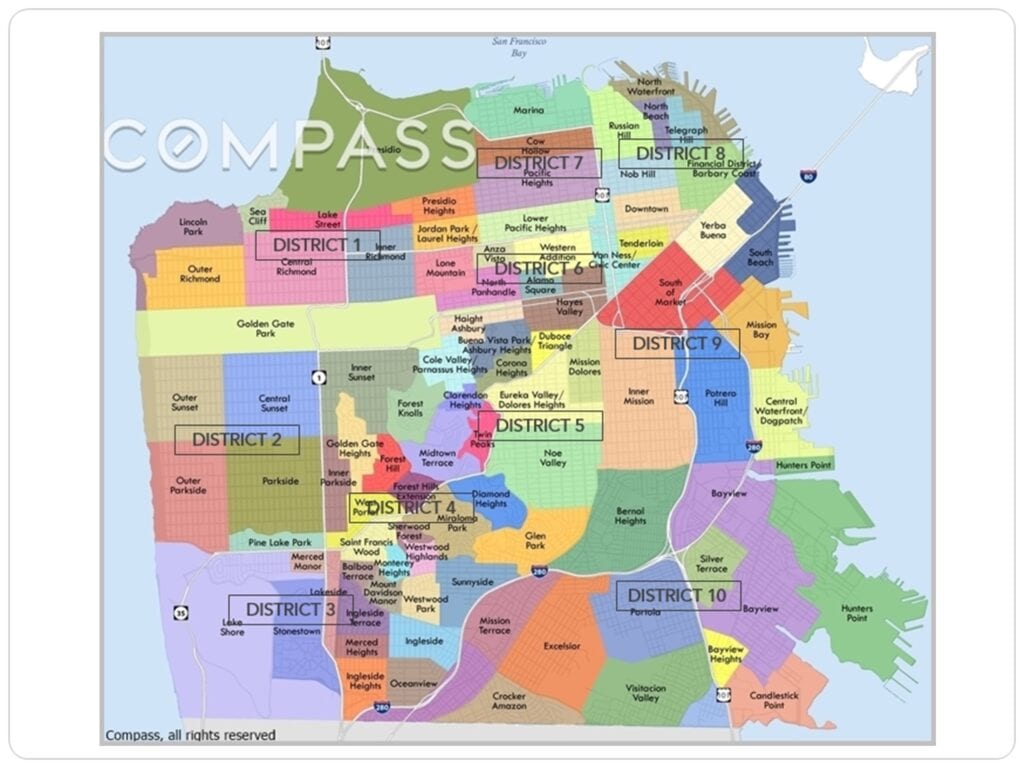
Within this San Francisco market report, market statistics on districts and neighborhoods follow the full-city analysis.
Statistics are generalities, essentially summaries of disparate data generated by dozens, hundreds or thousands of unique, individual sales. They are best seen nat as precise measurements, but as broad, comparative indicators, with reasonable margins of error. Anomalous fluctuations in statistics are not uncommon, especially in smaller markets with fewer sales. Q1 2021 numbers are estimates using data available in early April. Late reported sales may alter these numbers. Data from sources deemed reliable, but may contain errors and subject to revision. All numbers are approximate.
