San Francisco Real Estate Market Report – June 2021

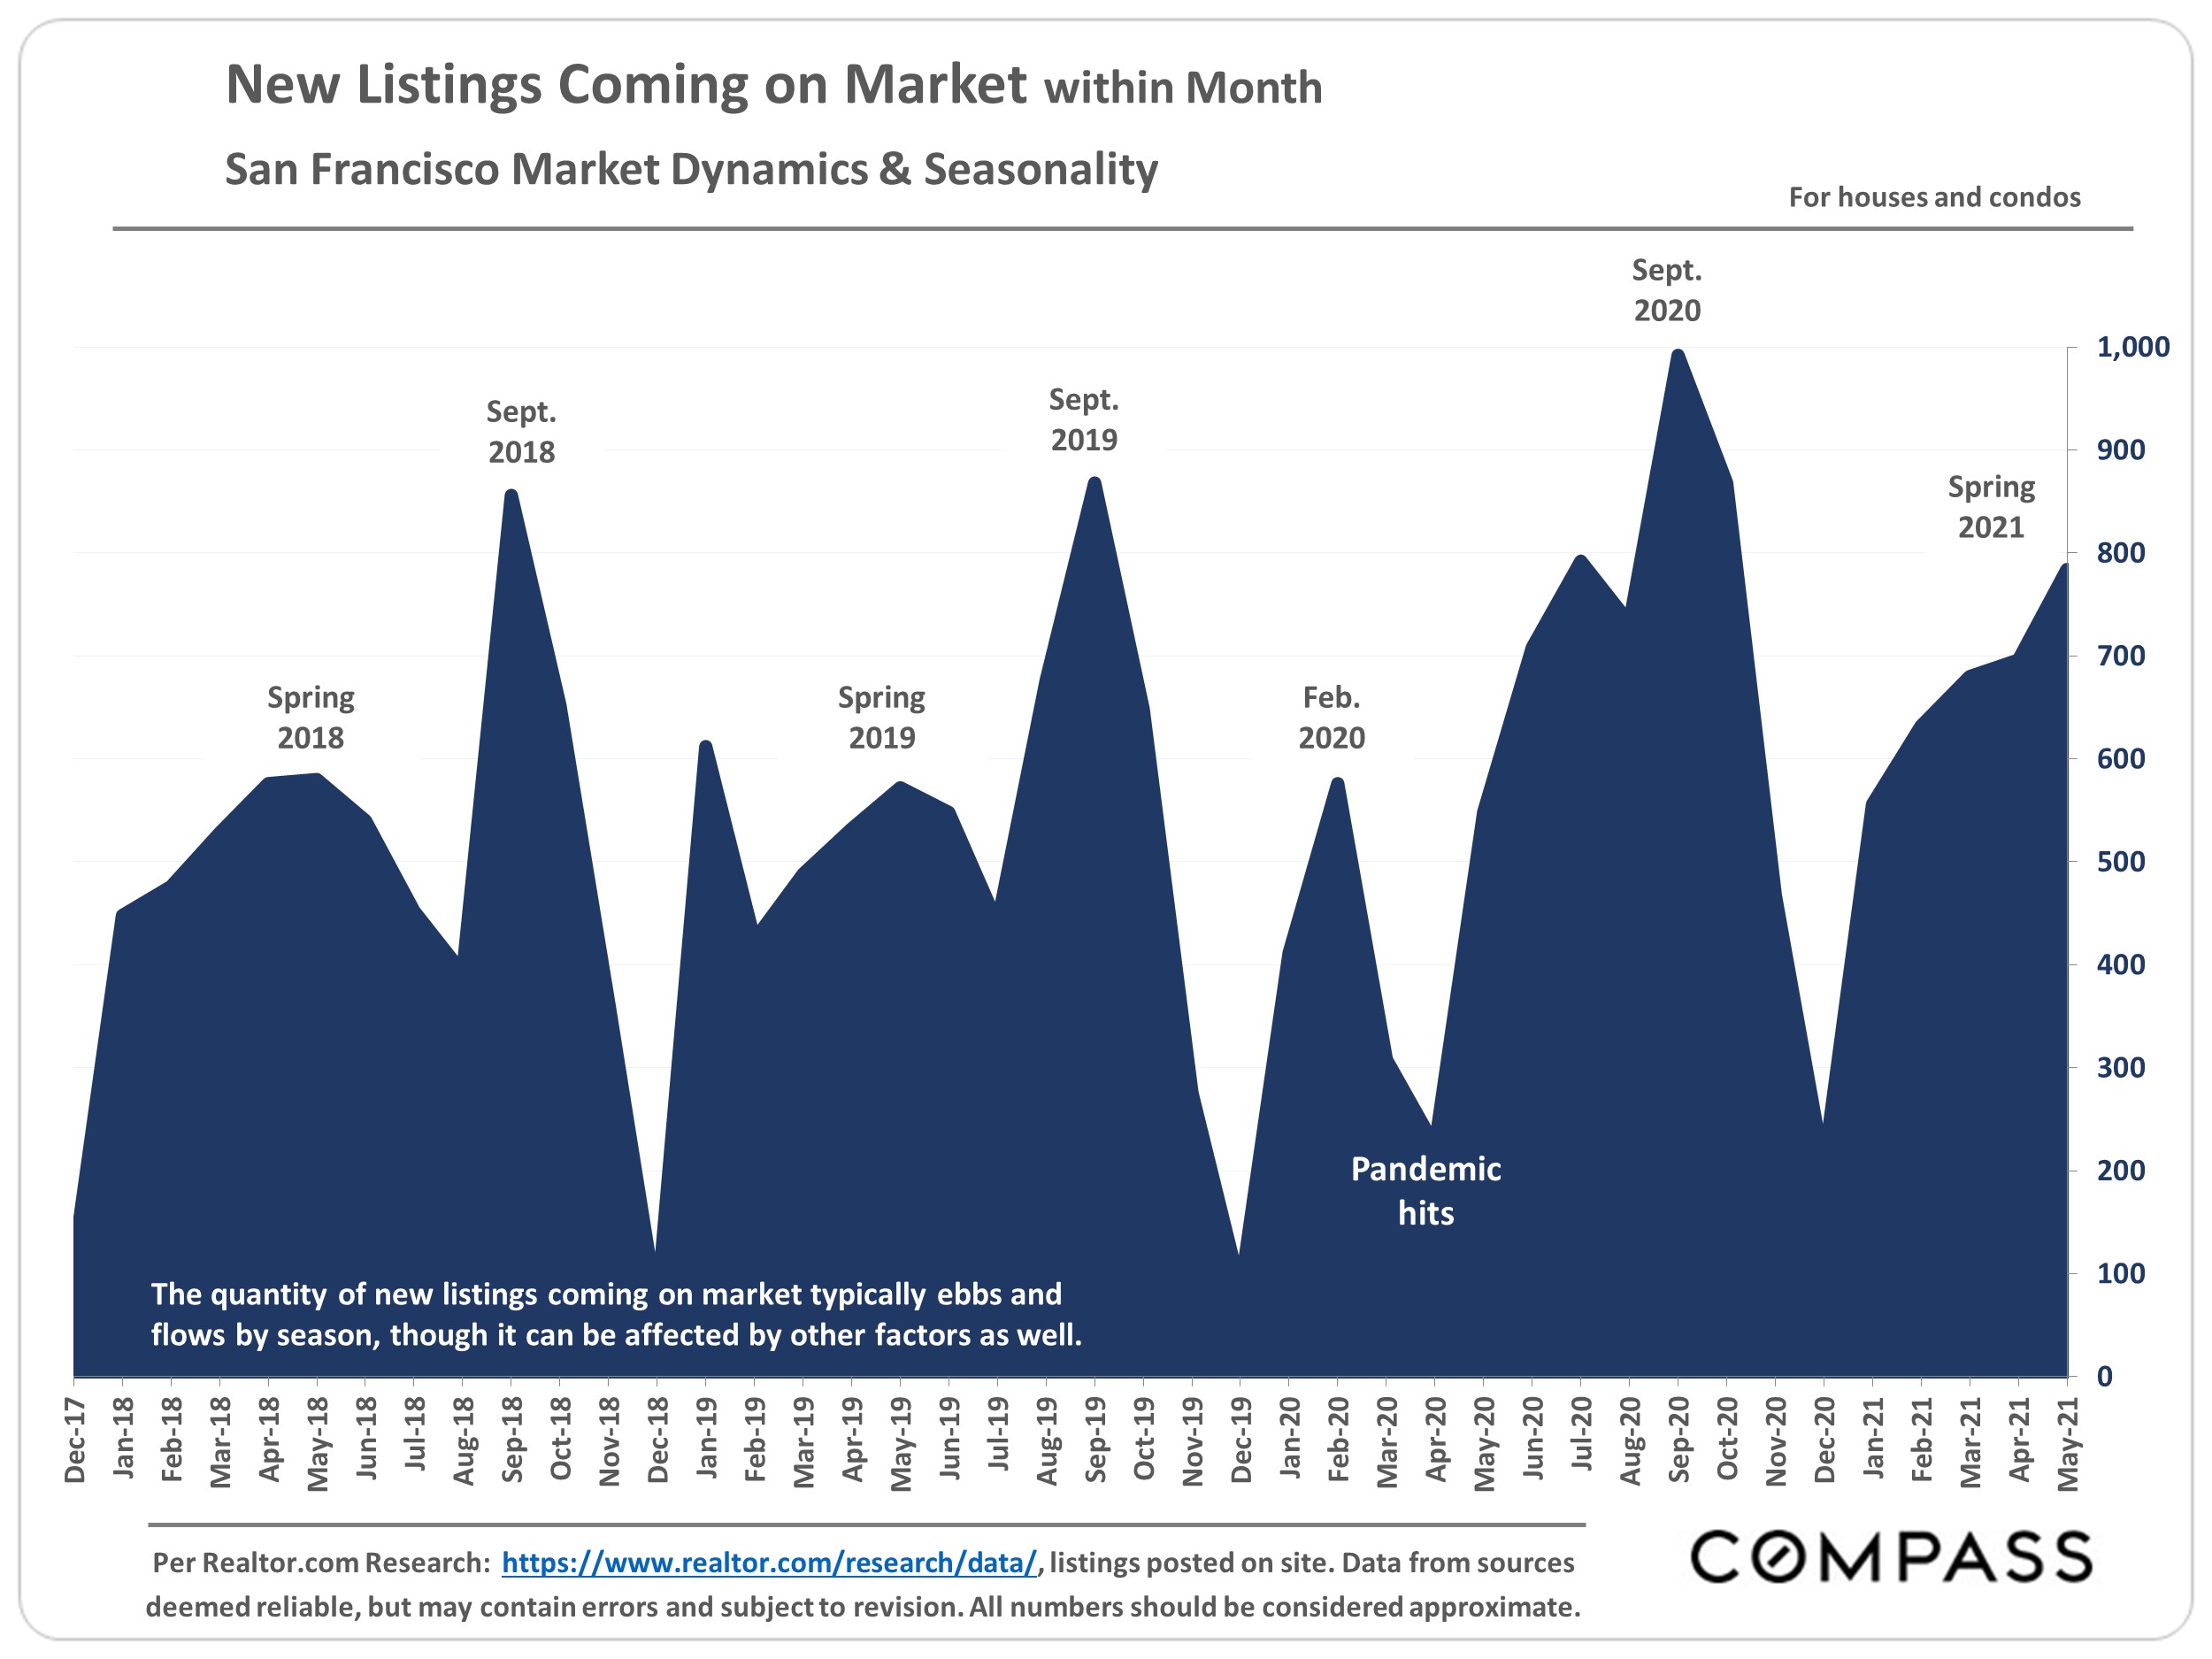
Why the Decline in Listings for Sale? A review of general issues, some of which apply to Bay Area markets more than others.
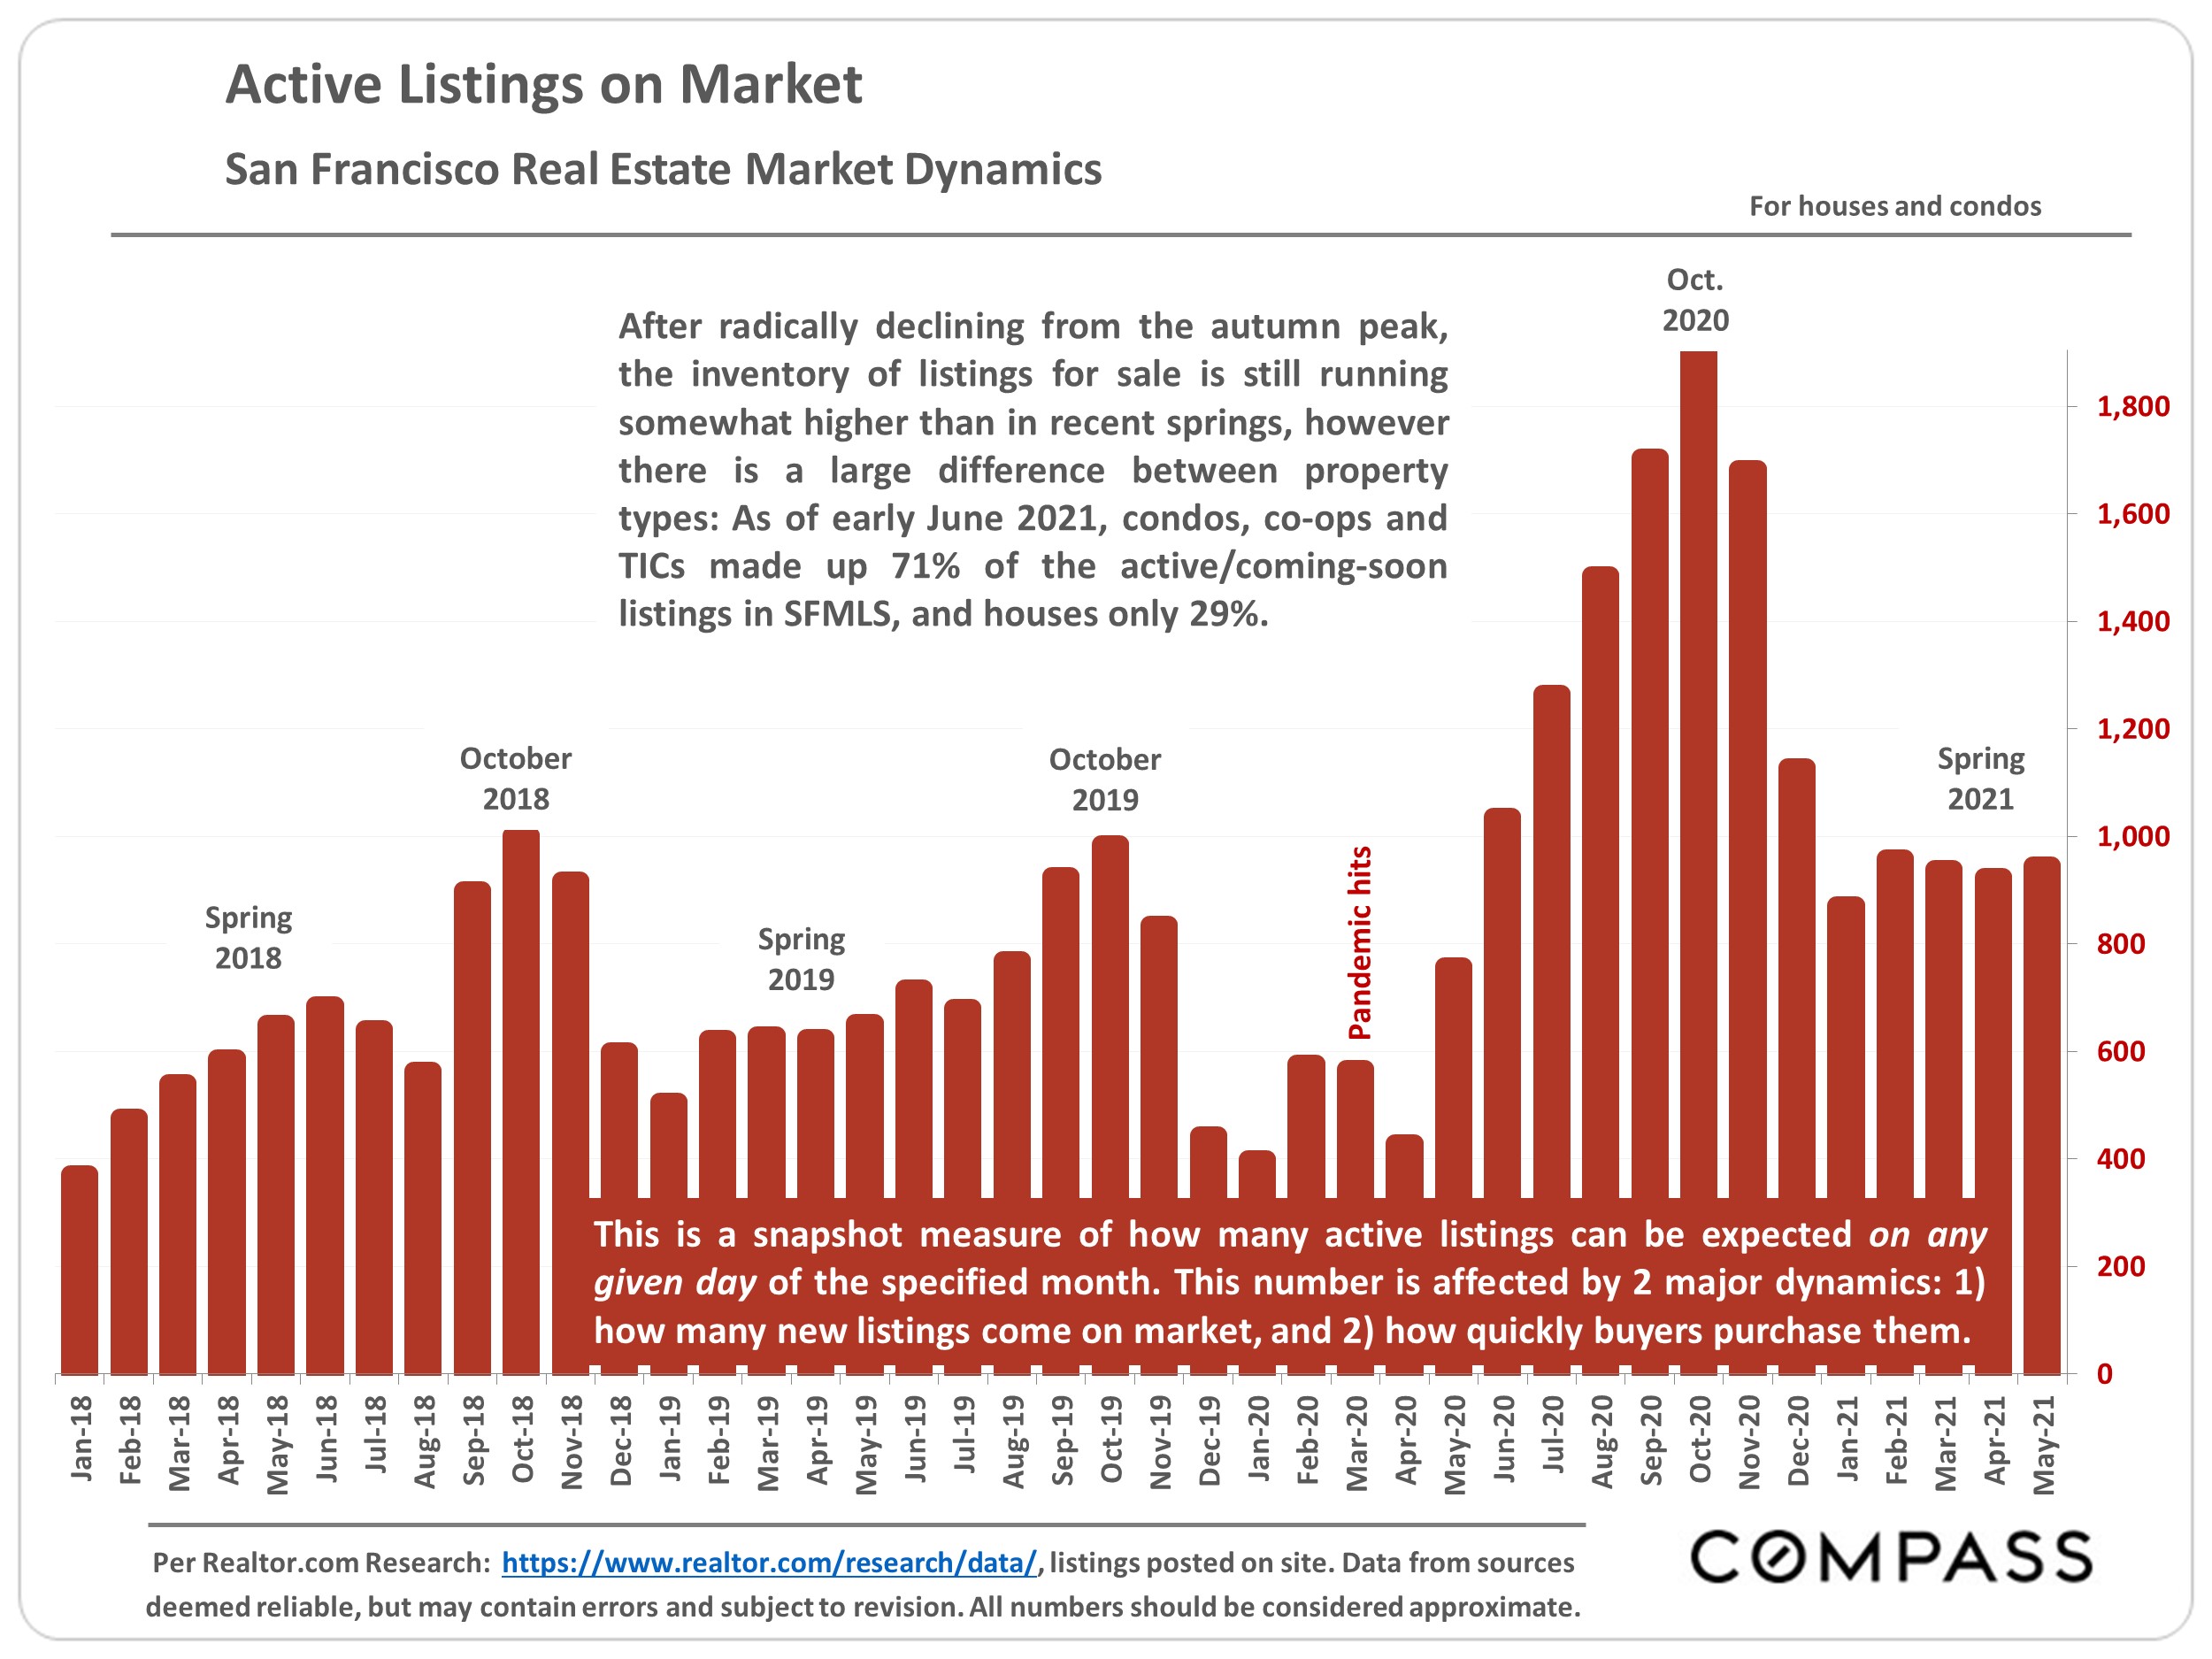
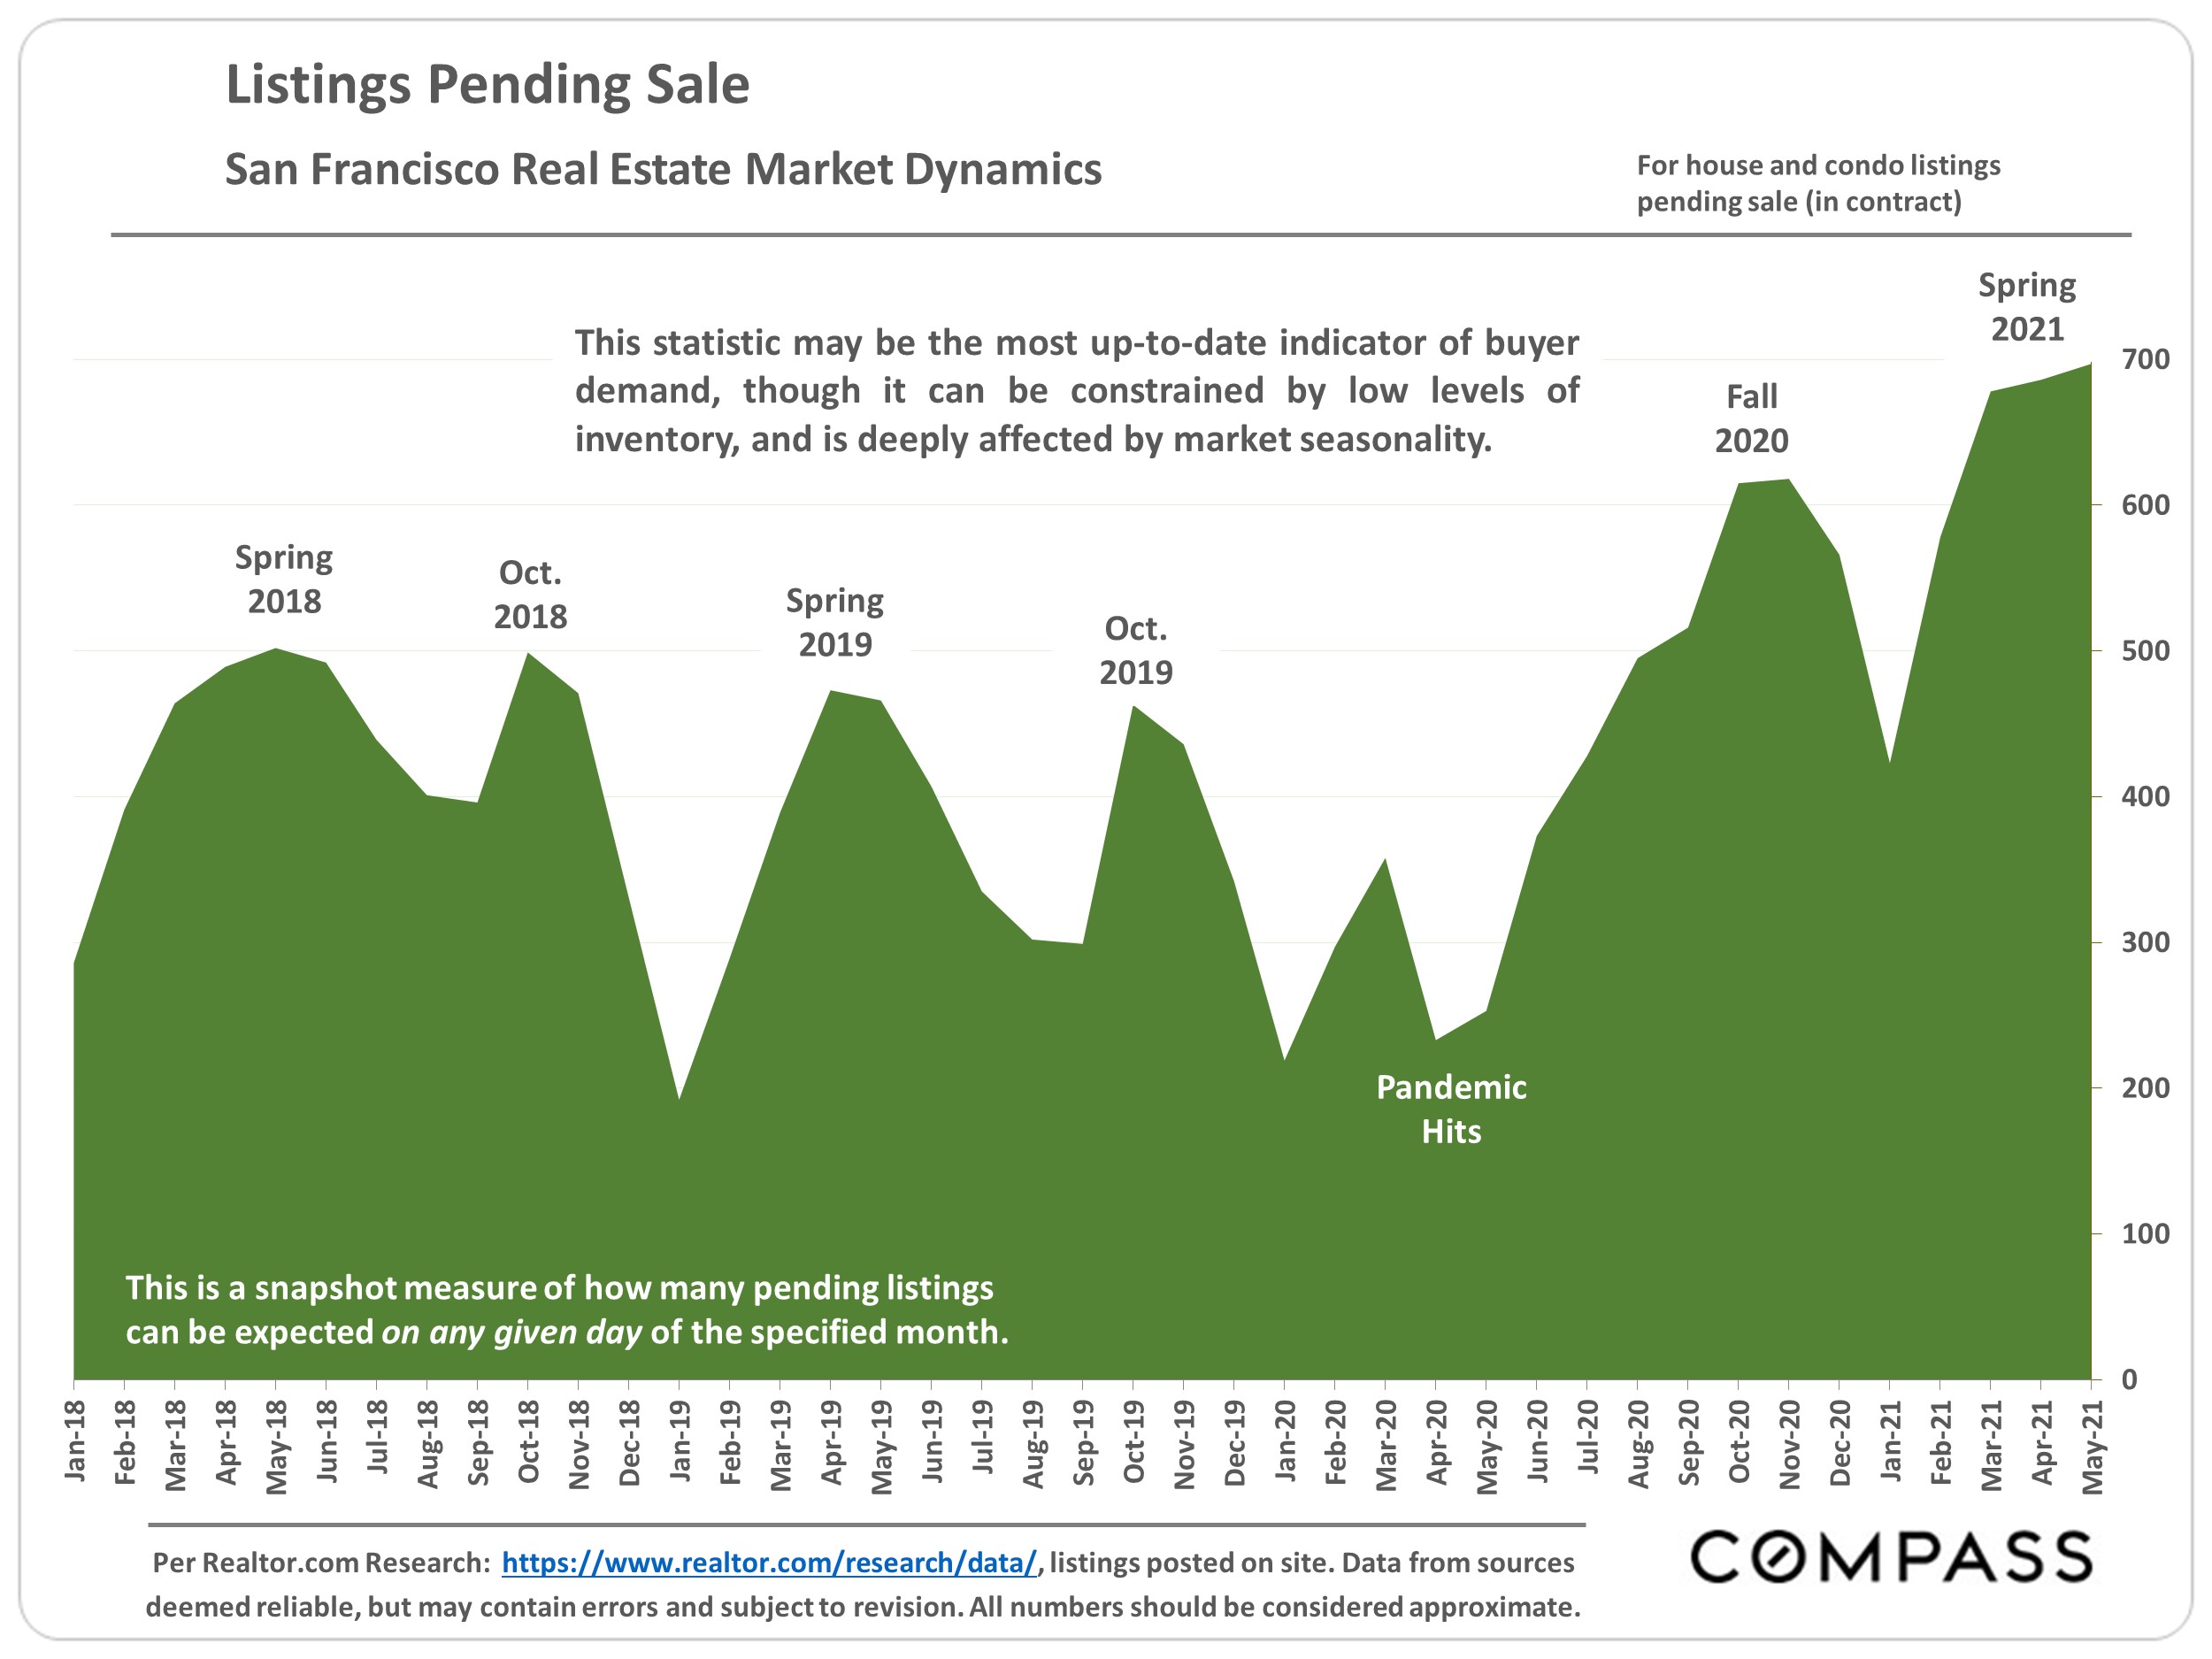
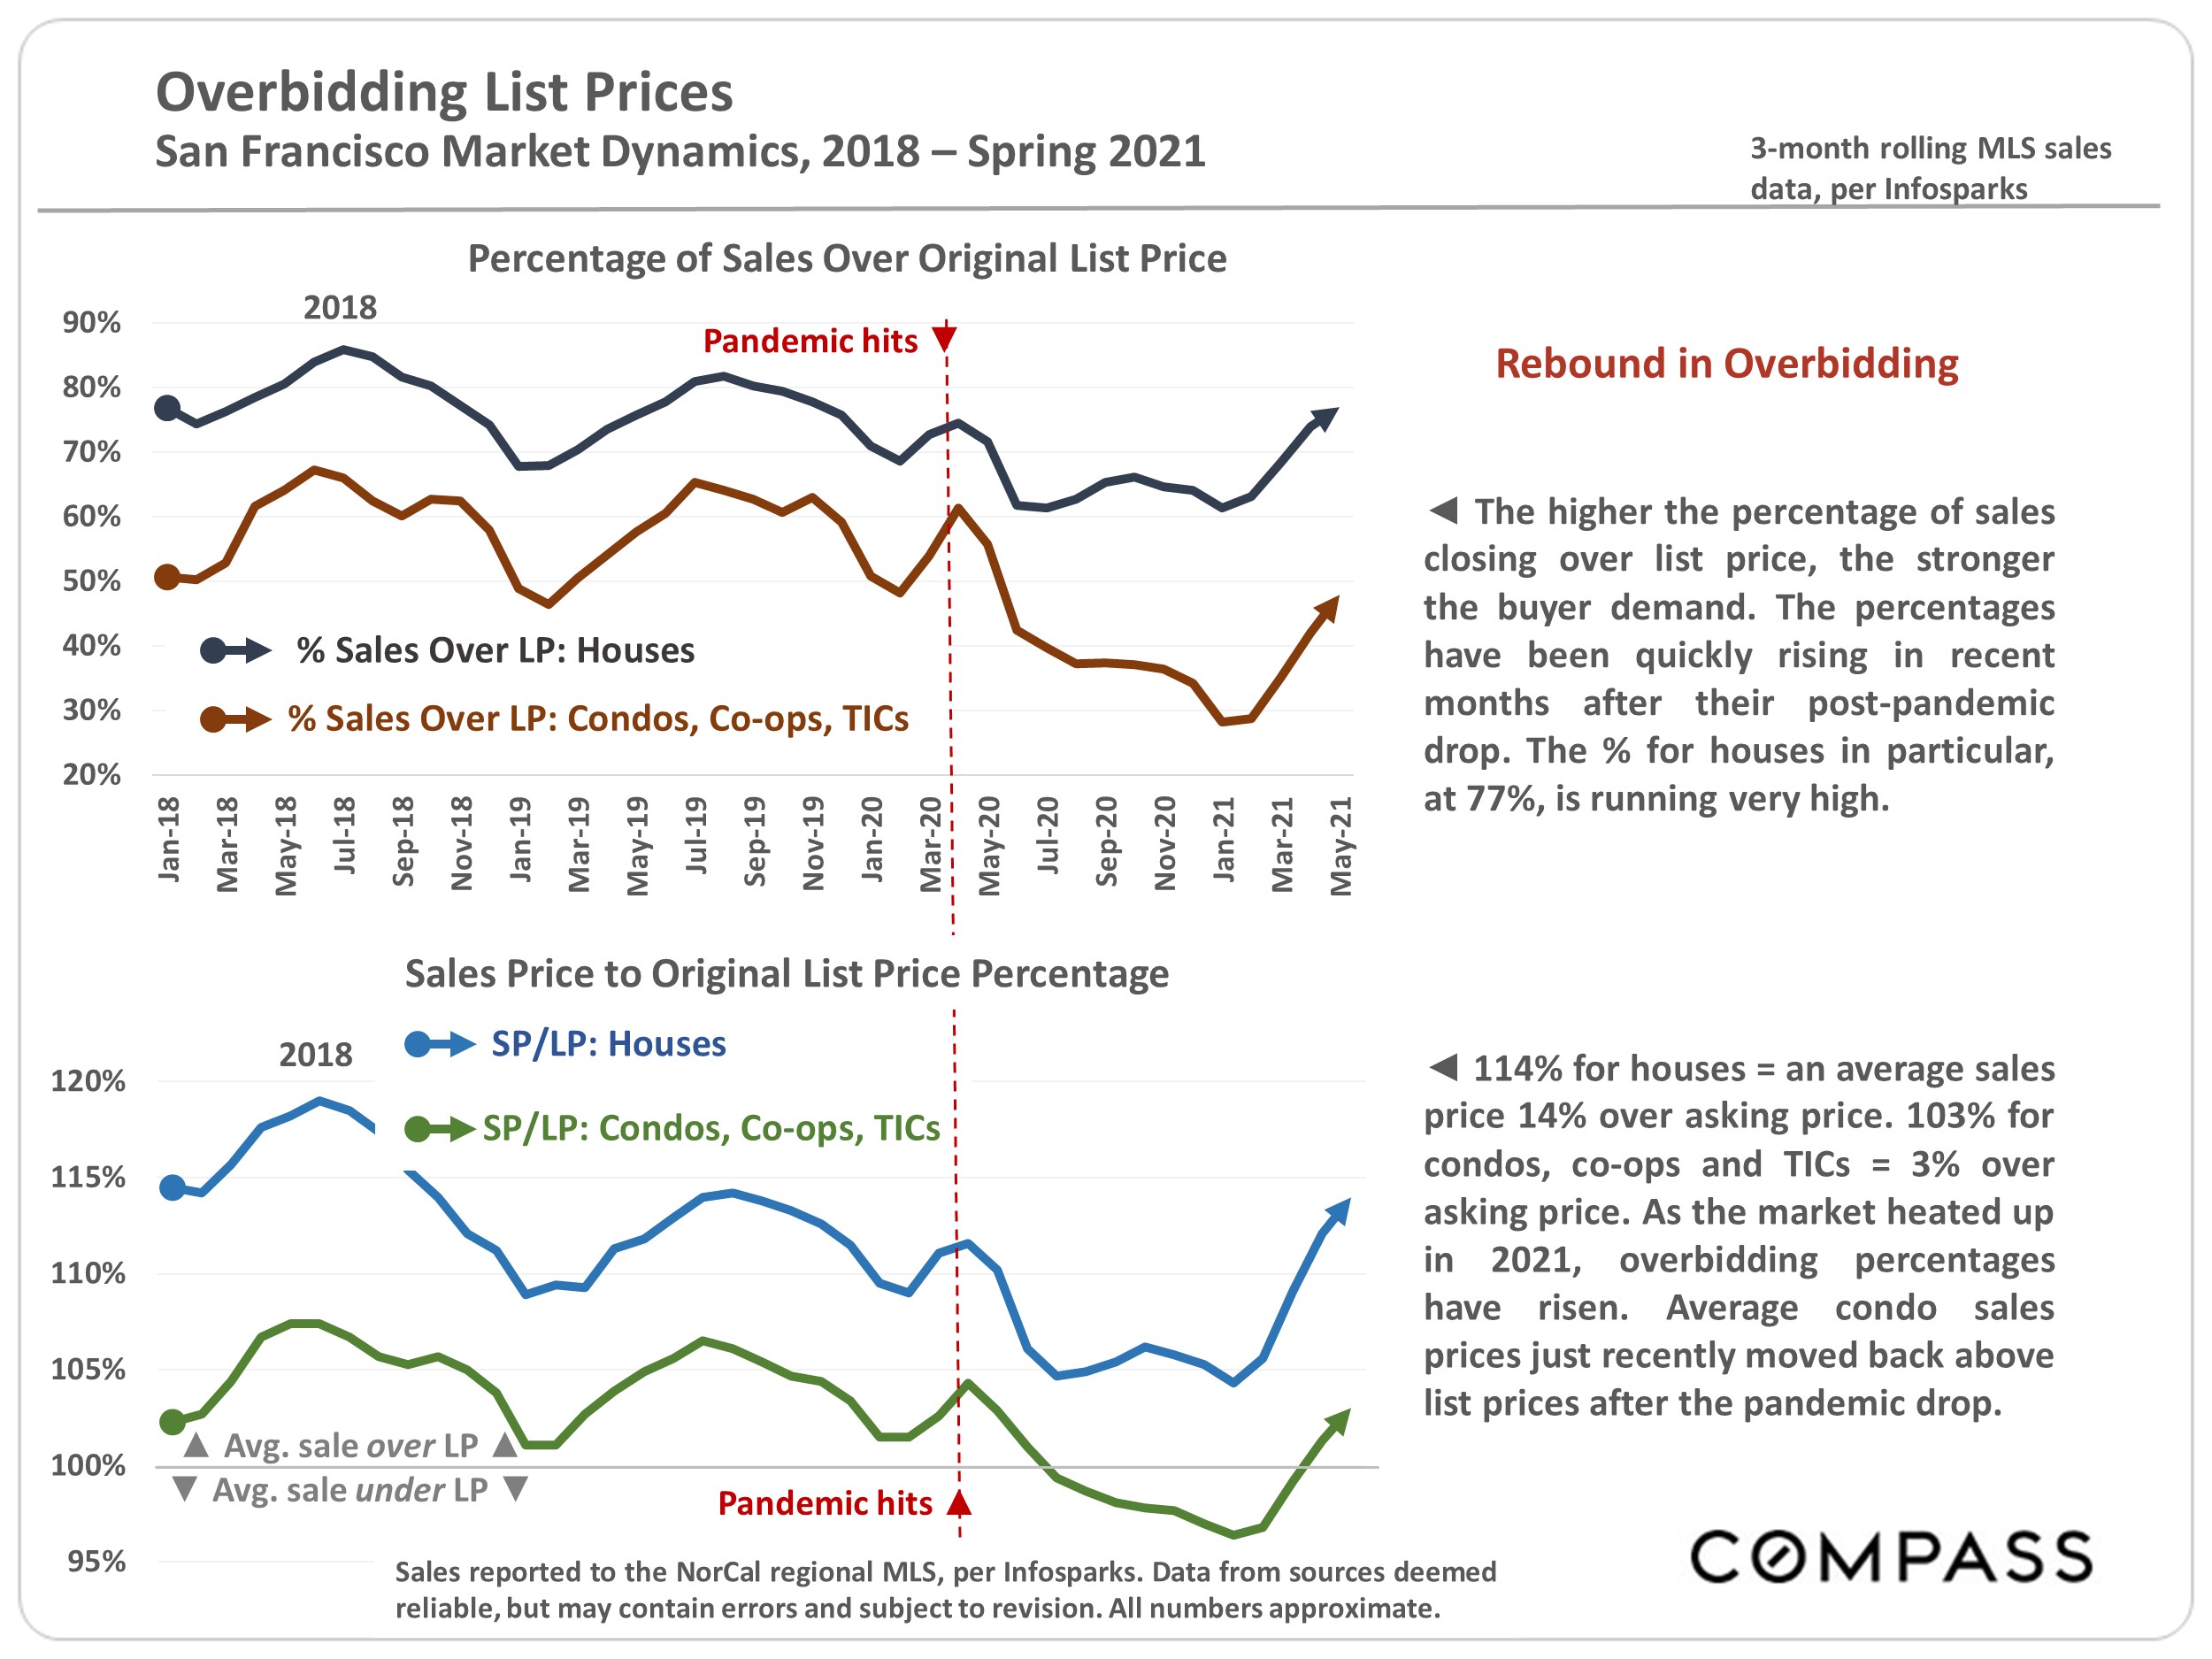
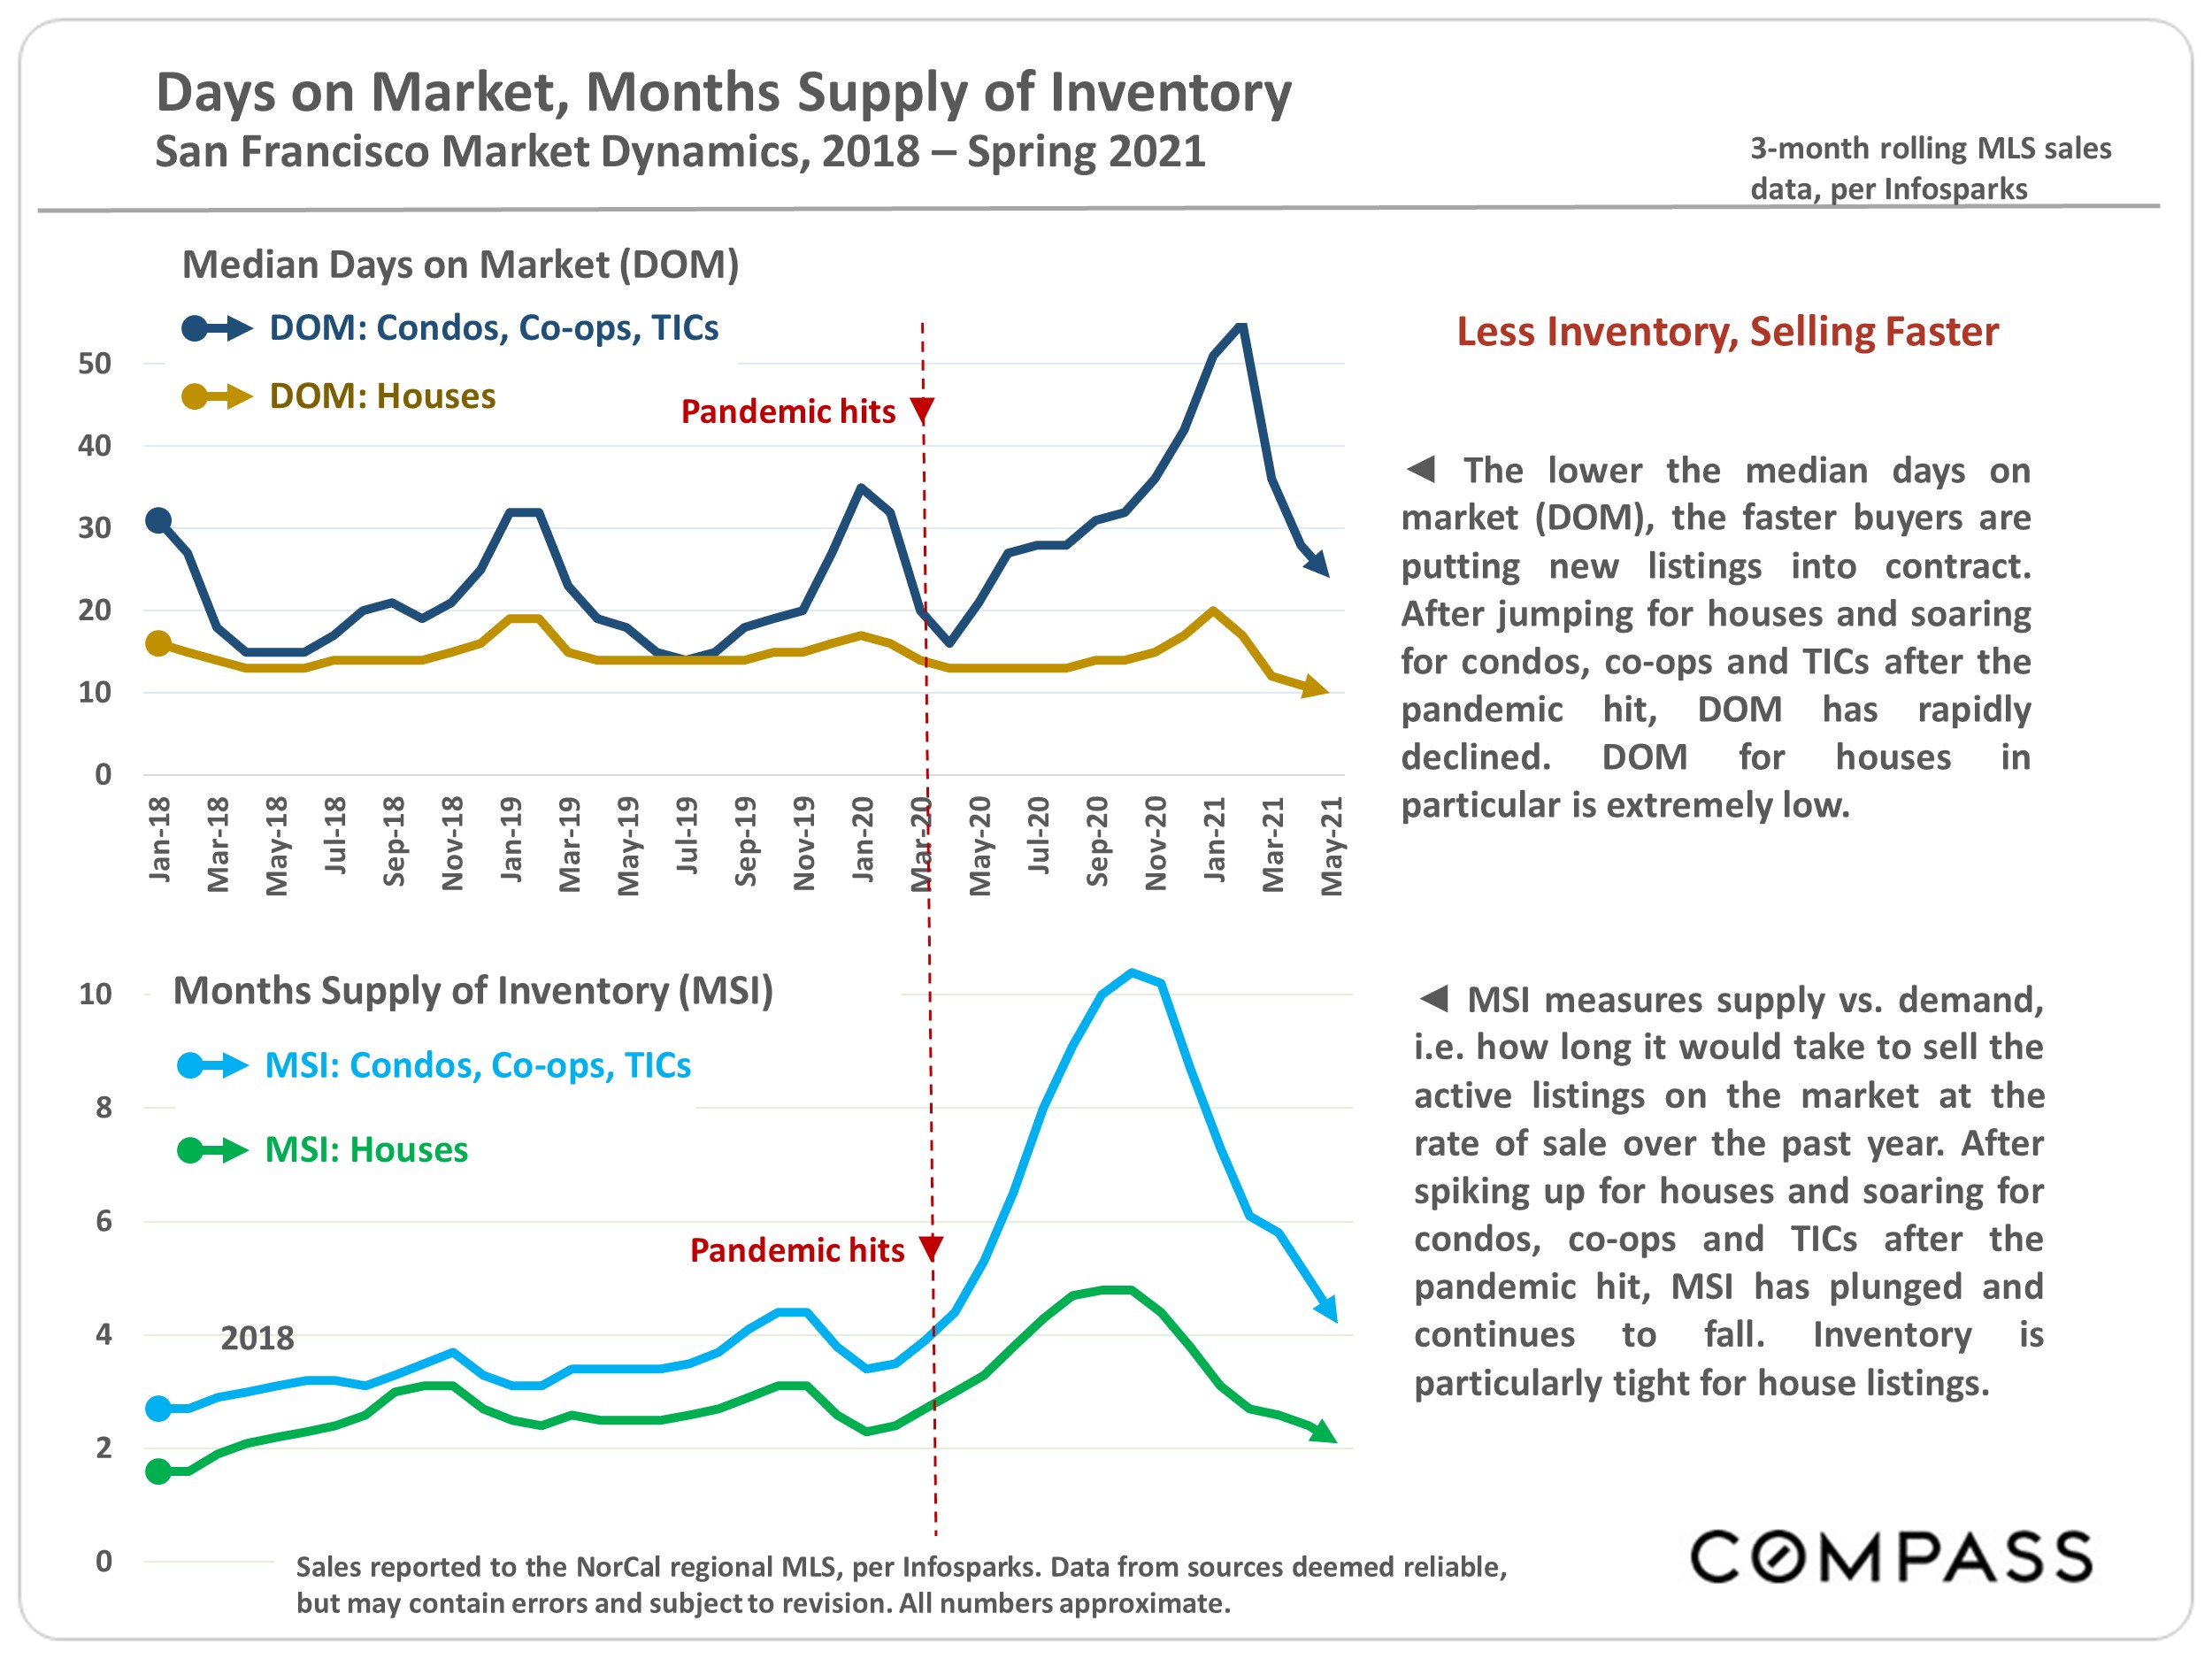
- Higher demand means a greater percentage of listings sell and sell more quickly. This significantly reduces the number of active listings on the market on any given day.
- As homes have become more expensive, homeowners have skewed older — and older people move much less frequently: They’re more affluent, more settled in careers, their families more established. The percentage of the population 55 years+ who own homes is over 76%; the percentage under 35 is39% (per Statista). The median age of homebuyers was 47 in 2019 vs. 39 in 2010 (per NationalAssociation of Realtors). As of 2020, homeowners stay in their homes an average of about 8 years vs. about 5 in 2010 (per Attom Solutions). This reduced turnover has an enormous impact on inventory.
Note: Condo owners generally skew younger than house owners and move more frequently. That, plus new-condo construction and pandemic-related issues, kept Bay Area condo prices inventory substantially higher than house inventory over the past year.
- Investors, institutional and individual, have been purchasing a higher percentage of U.S. homes to use as rental properties — currently 20% of housing sales (per John Burns Consulting). This began during the foreclosure crisis (by hedge funds) and accelerated with the current, desperate search for yield.Investors sell much less frequently, with considerable impact on the resale market. Besides income —boosted by extremely low, mortgage rates — and potential appreciation, investors also enjoy very significant tax advantages, enhanced in the tax-law changes of 2017.
- Some homeowners are turning their homes into long-term rentals or vacation rentals (such as Airbnb) instead of selling them when moving to new homes.
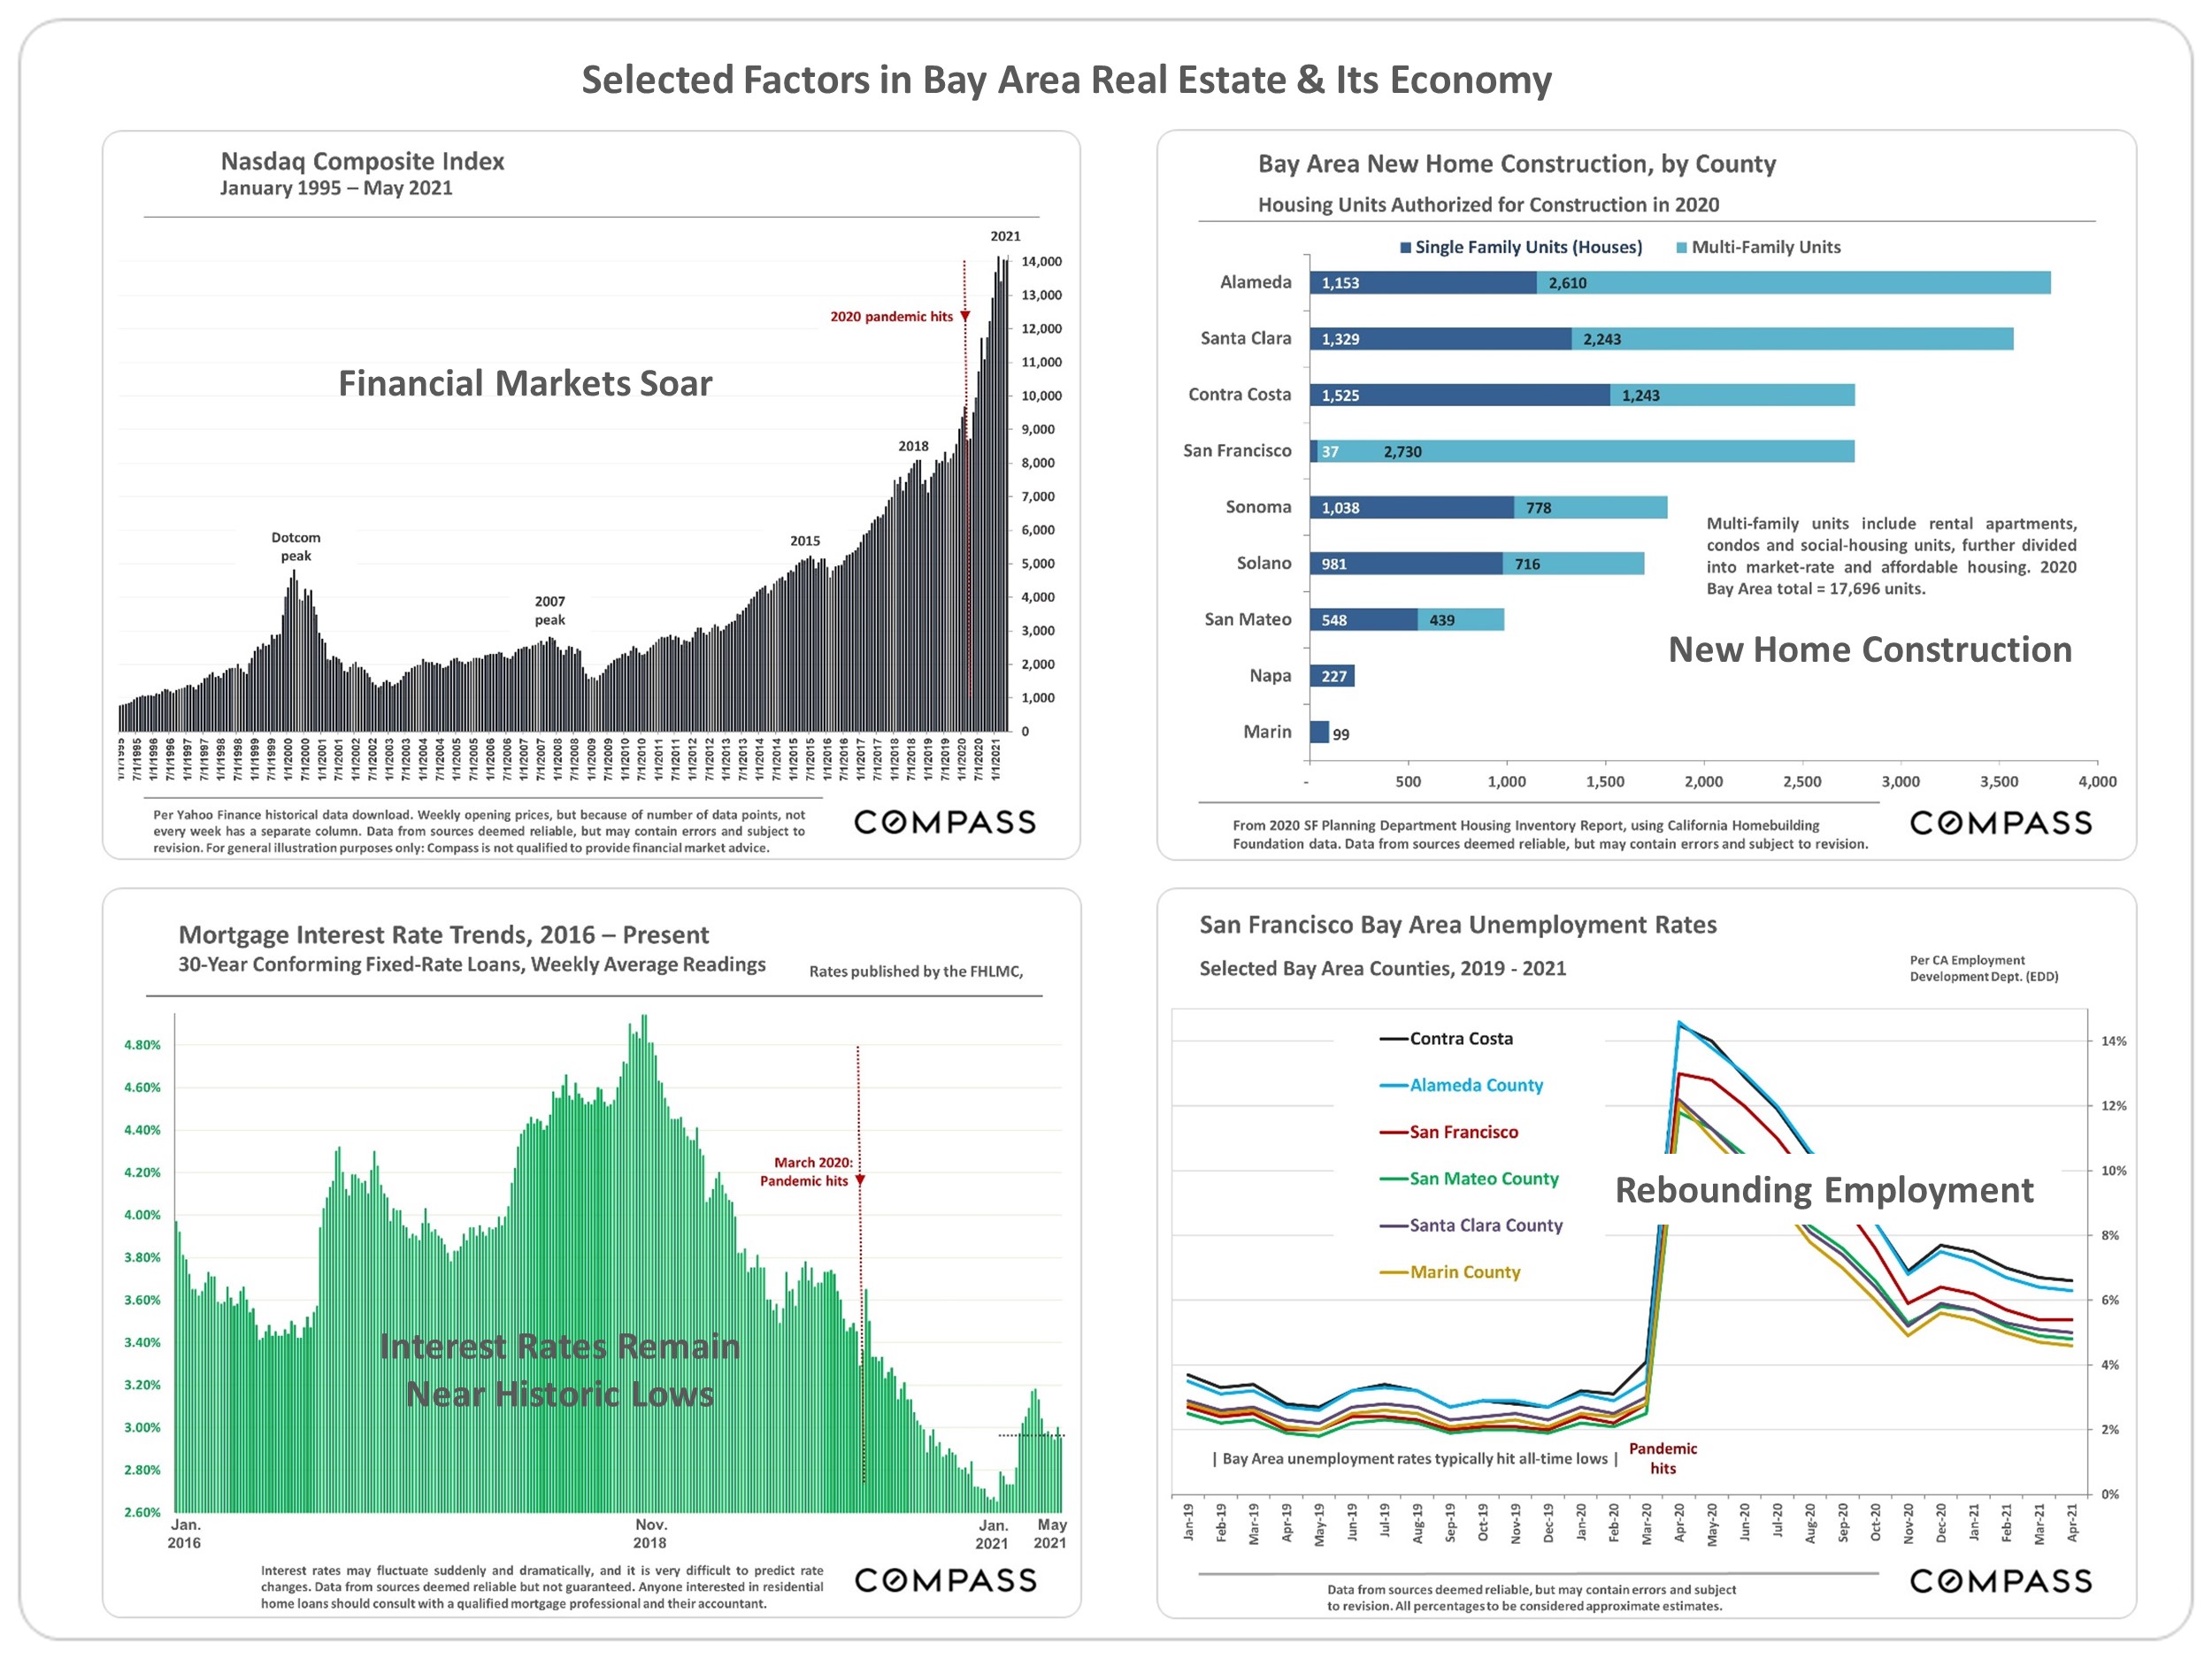
- In many markets, new home construction has declined (or remained extremely low for years).
- It appears more homes are being marketed off-MLS. Strictly speaking, this is not a reduction in inventory, but does reduce the # of listings available using typical sources of public listing data (and affecting the statistics based on them).
