
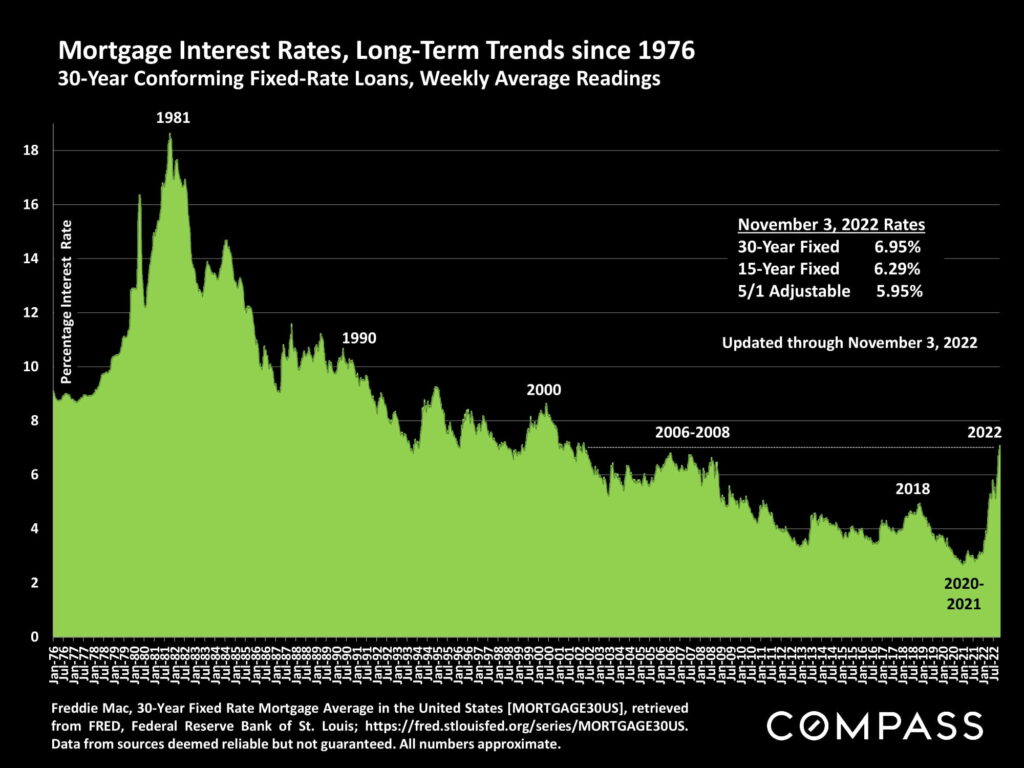
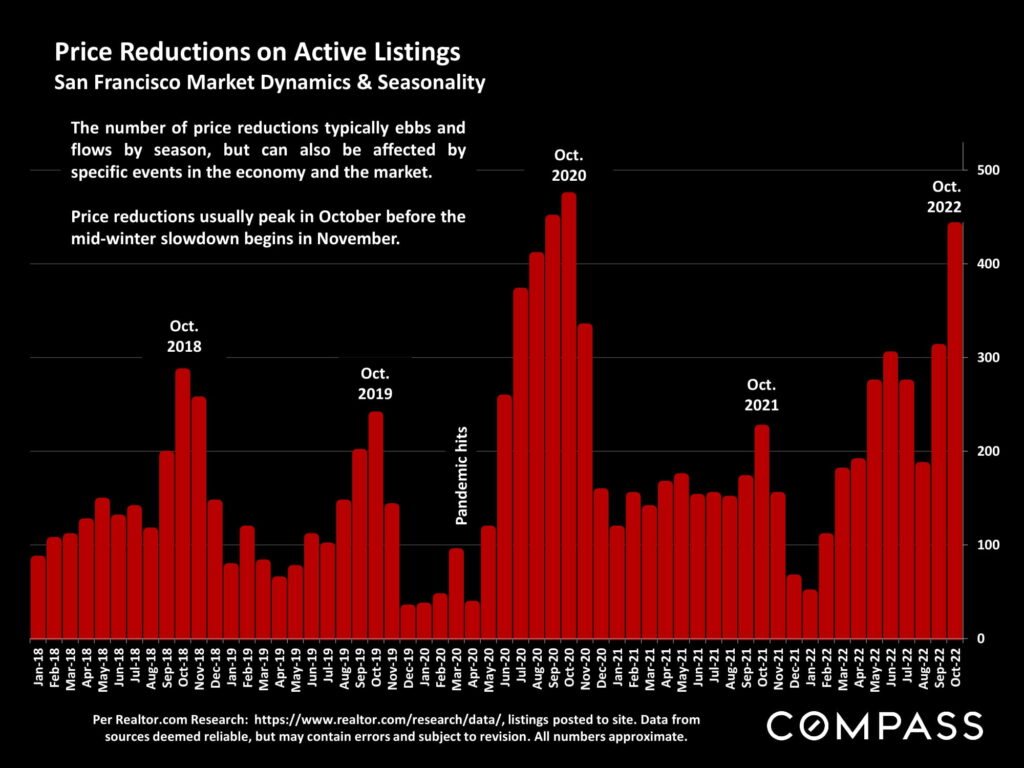
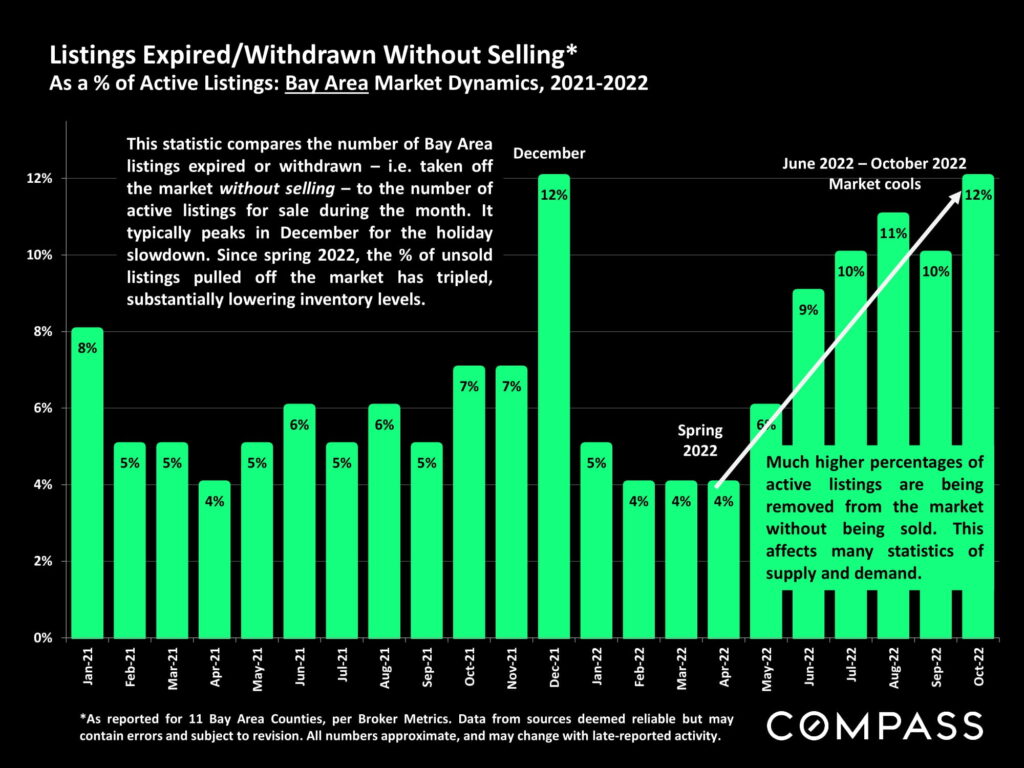
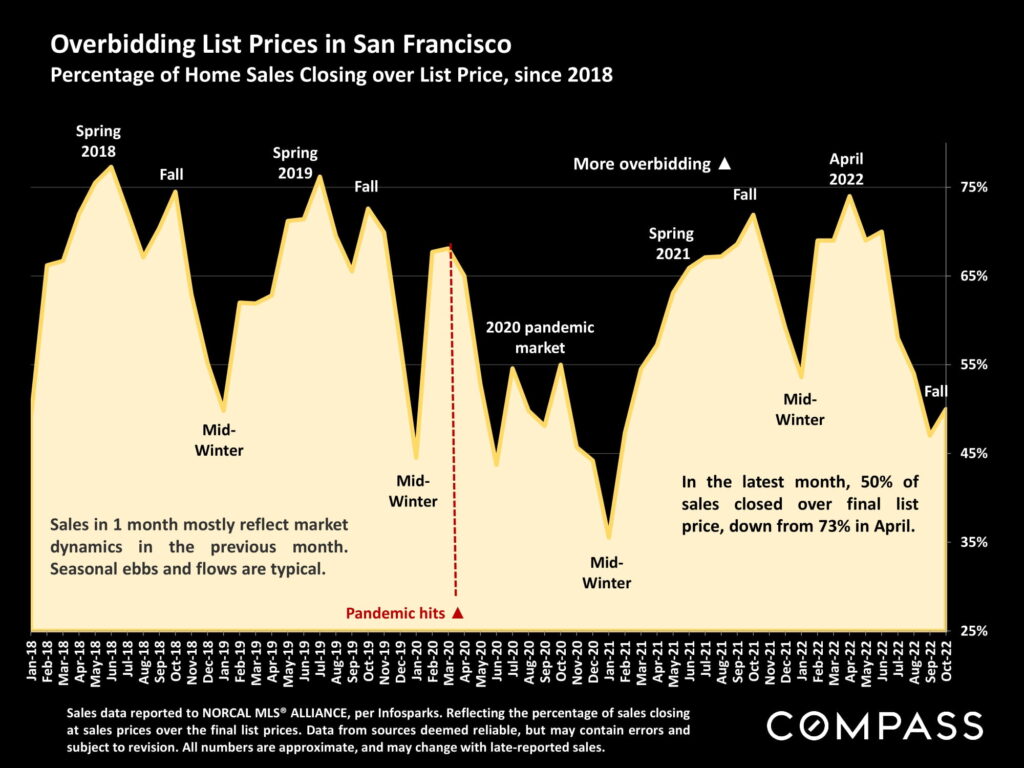
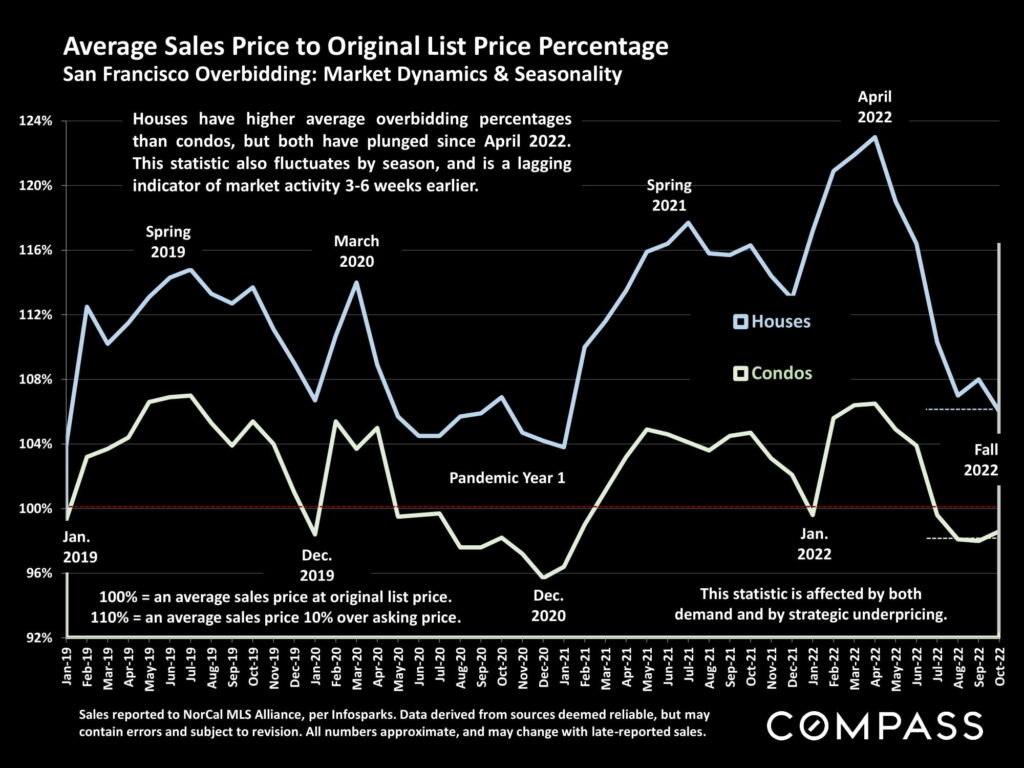
After a brief rebound in market activity in August, pursuant to what turned out to be a very temporary decline in interest rates and an associated rebound in financial markets, macroeconomic conditions shifted again – with interest rates climbing rapidly to a 20-year high – which took a toll on early autumn, Bay Area average home price. Though across the Bay Area, thousands of homes continued to be sold – a significant, but declining proportion still selling quickly over list price – the general trend was one of cooling demand, less competition, and declining sales. And, after years of conclusively holding the balance of power, sellers have reacted to the changing circumstances in different ways: Besides increased price reductions since spring, the number of new listings coming on market is well down year over year, and a much higher percentage of listings than normal is being removed from the market without selling. The economy and housing market remain in a period of adjustment, causing many people to be more cautious as they wait to see how things will settle out.
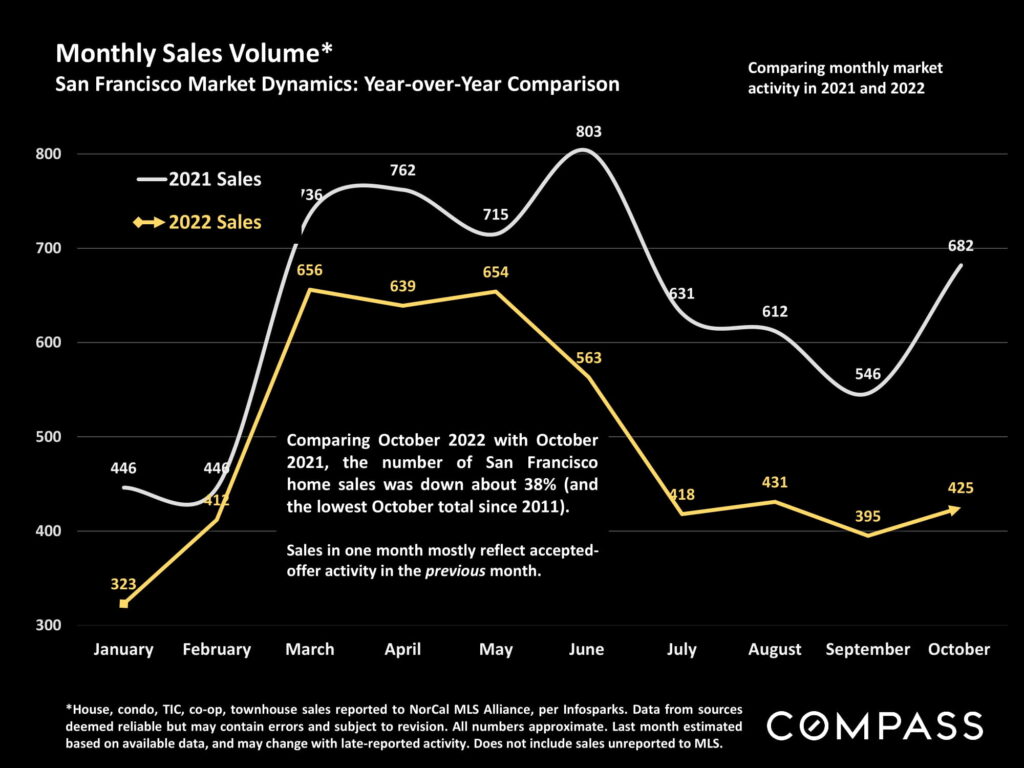
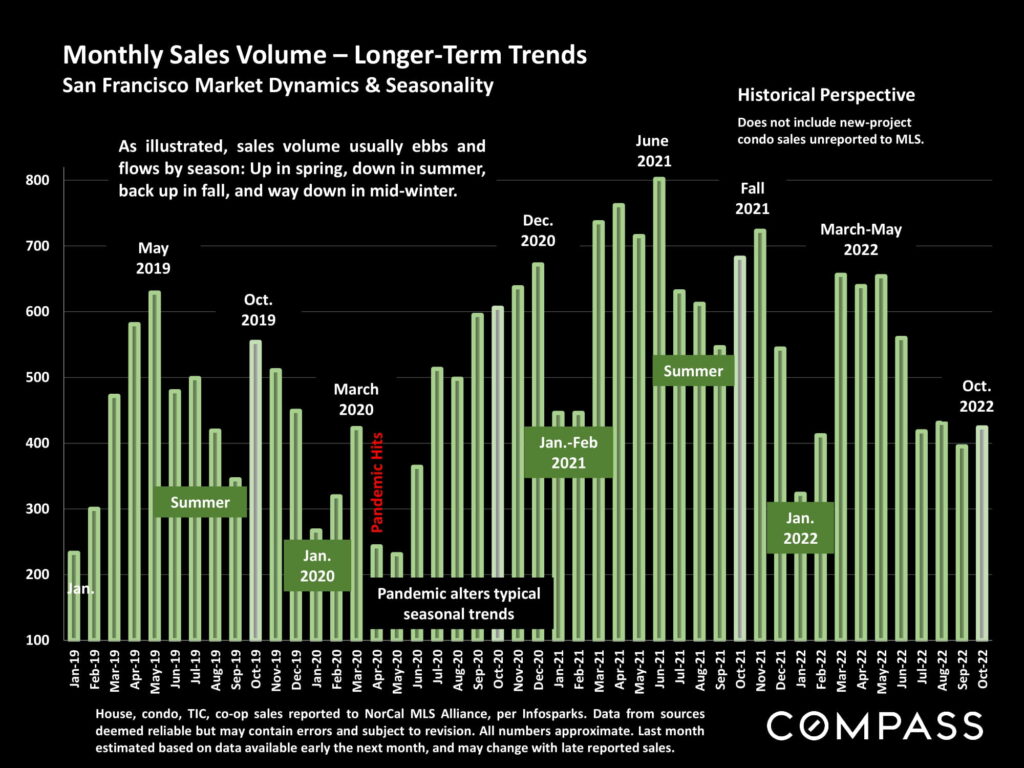
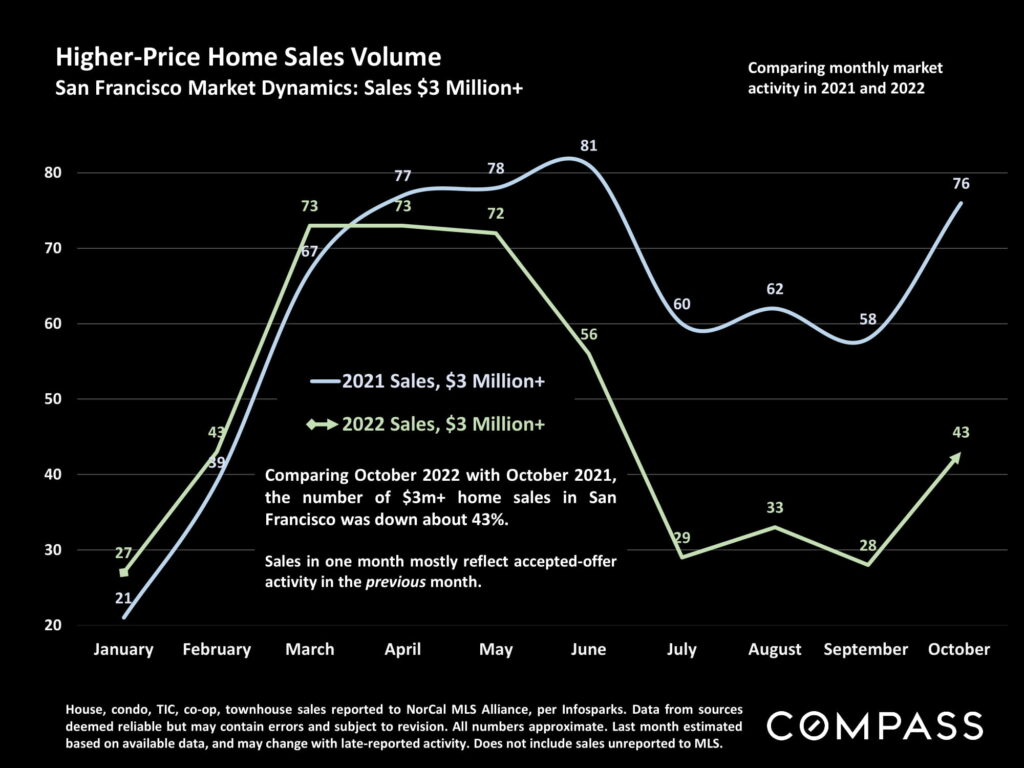
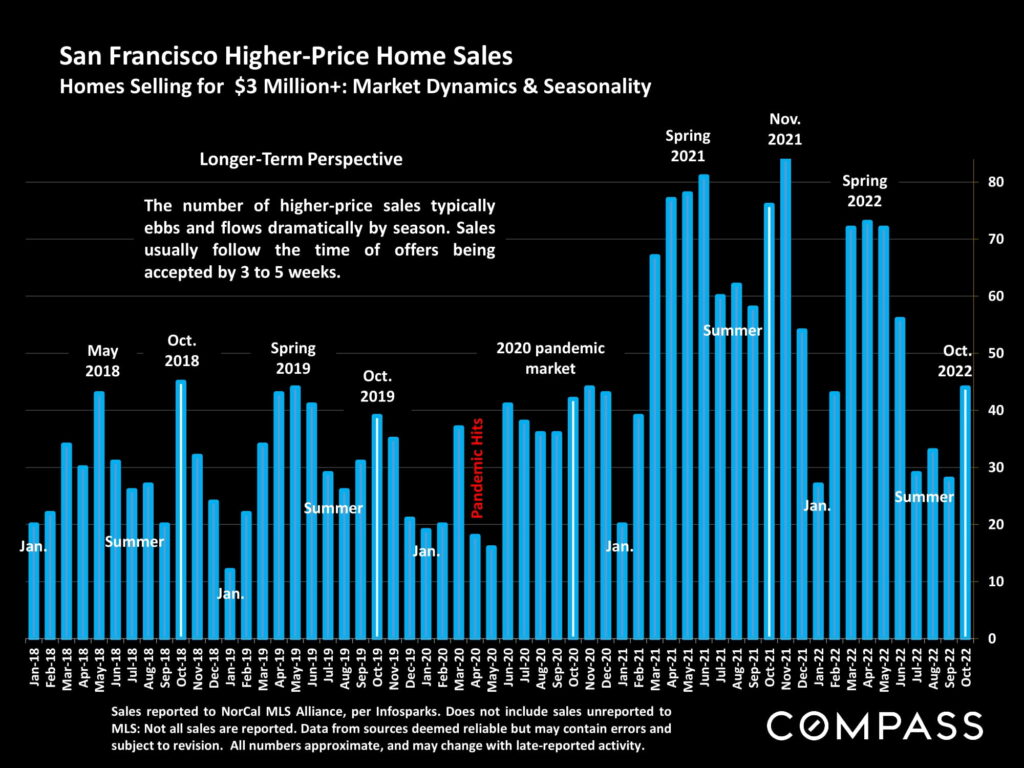
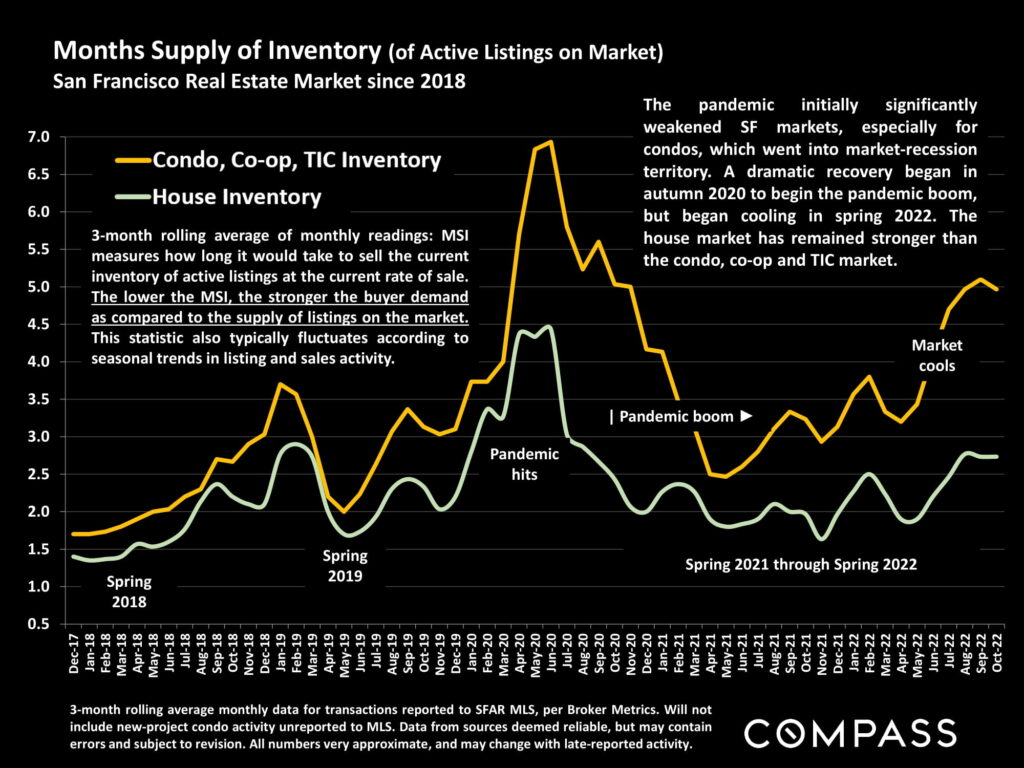
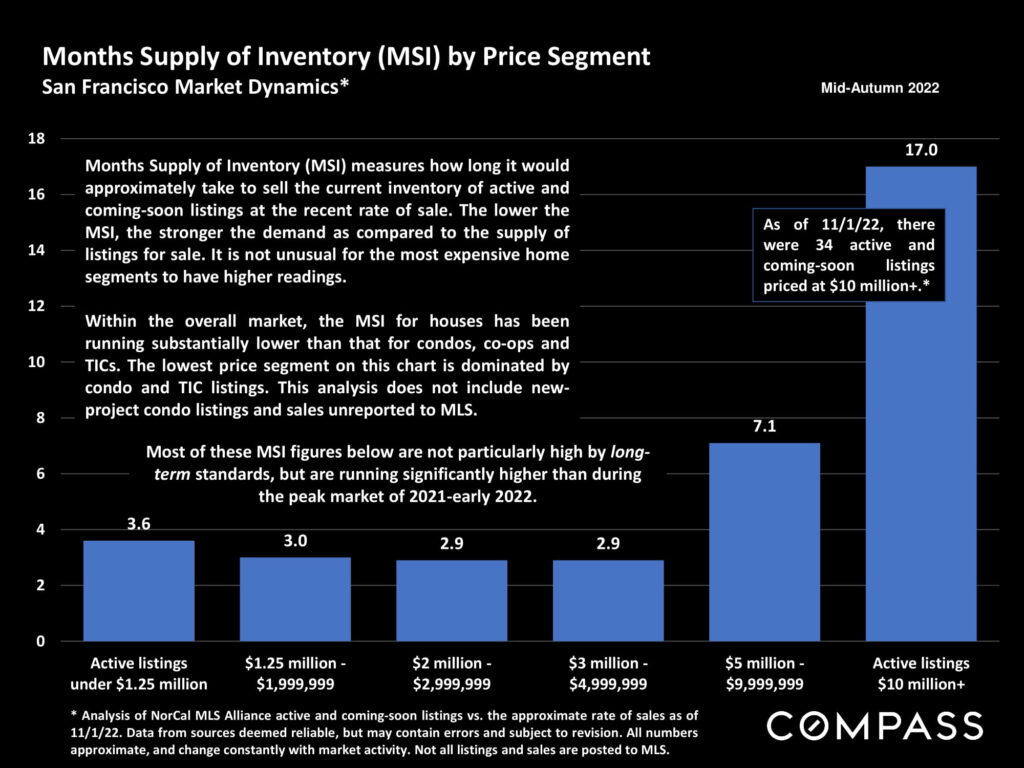
All these factors added up in San Francisco real estate market to October 2022 having the lowest number of October home sales since 2011. On a year-over-year basis, higher-price home sales of $3 million+ fell further (-43%) than the general market (-38%) in October.
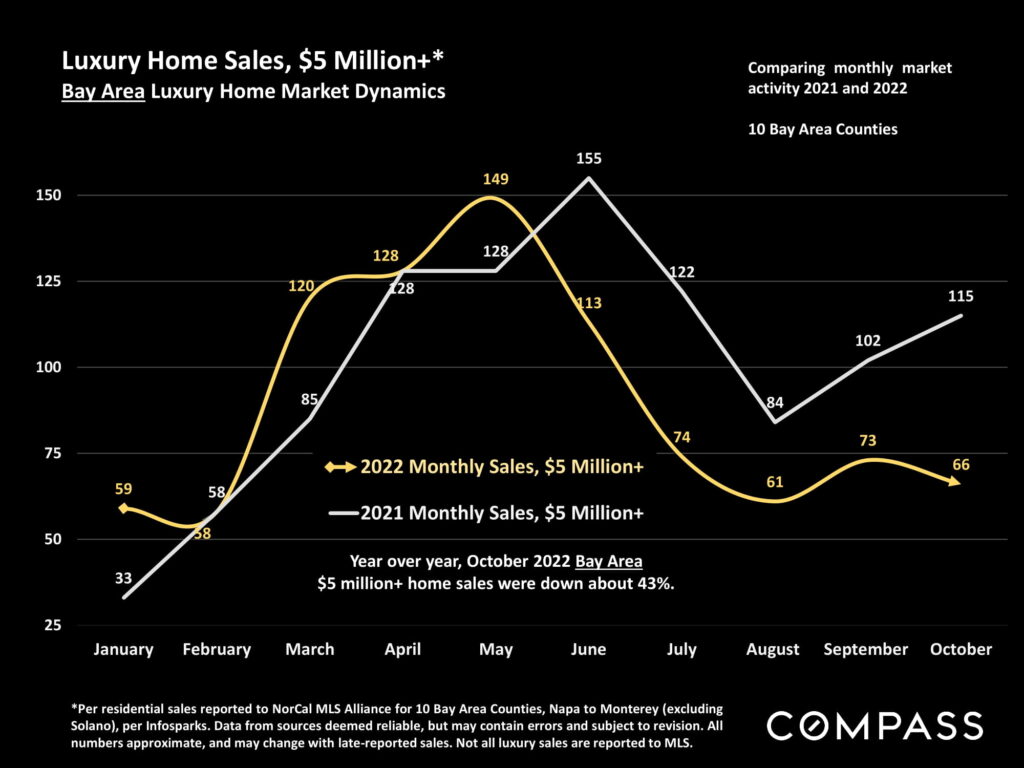
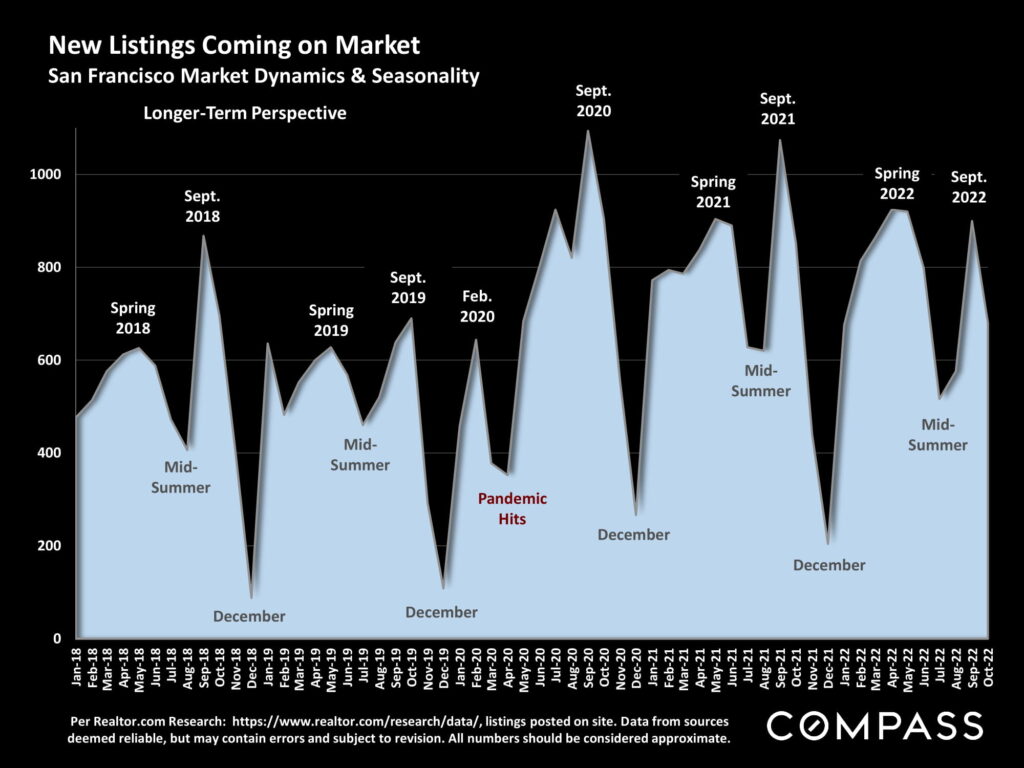
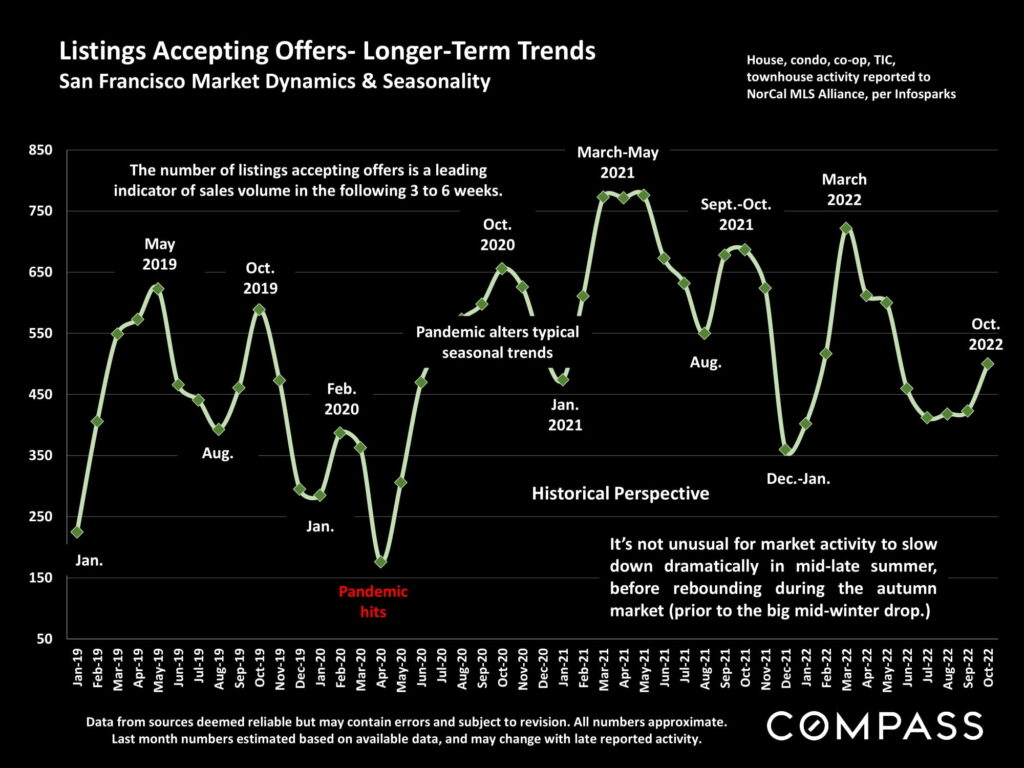
The market now enters the 2-month holiday period which typically sees the year’s lowest levels of activity: The numbers of new listings and of listings going into contract usually plunge to their annual nadirs, and an increasing percentage of sellers, especially in higher price segments, pull their homes off the market to await the new year. (Many listings taken off market in November and December will presumably be relisted in Q1 2023.) Still, buying and selling continues, though at reduced levels, and this can be an excellent time for buyers to aggressively negotiate prices.
Market dynamics and statistics vary by county, property type and price segment.
Our reports are not intended to convince you regarding a course of action or to predict the future, but to provide, to the best of our ability, straightforward information and good-faith analysis to assist you in making your own informed decisions. Statistics should be considered very general indicators, and all numbers should be considered approximate. How they apply to any particular property is unknown without a specific comparative market analysis.
Selected Excerpts from National Survey of Home Buyers & Sellers
By the National Association of REALTORS® (NAR)
“The median distance between the home that recent buyers purchased and the home from which they
moved was 50 miles – a record high and more than a three-fold jump from a median of 15 miles from
2018 through 2021.”
“The shares of buyers who purchased homes in small towns (29%) and rural areas (19%) were the highest
ever recorded, while the shares of homes purchased in suburban (39%) and urban (10%) locations
declined from one year ago.”
“First-time buyers made up only 26% of all buyers, down from 34% last year and a peak of 50% in 2010
during the First-Time Home Buyer Tax Credit. The age of the typical first-time buyer was 36 years – up
from 33 years one year ago – and the typical repeat buyer’s age climbed to 59 years from 56 years in
2021. Both ages are the highest in the history of the data set.”
“Seventy-eight percent of recent buyers financed their home purchase, down from 87% last year and
driven by the increased share of repeat buyers who paid all cash.”
“The median age of home sellers was 60 years, up from 56 years one year ago. Sellers typically lived in
their home for 10 years before selling.”
Statistics are generalities, essentially summaries of widely disparate data generated by dozens, hundreds or thousands of
unique, individual sales occurring within different time periods. They are best seen not as precise measurements, but as broad,
comparative indicators, with reasonable margins of error. Anomalous fluctuations in statistics are not uncommon, especially in
smaller, expensive market segments. Last period data should be considered estimates that may change with late-reported
data. Different analytics programs sometimes define statistics – such as “active listings,” “days on market,” and “months supply
of inventory” – differently: what is most meaningful are not specific calculations but the trends they illustrate. Most listing and
sales data derives from the local or regional multi-listing service (MLS) of the area specified in the analysis, but not all listings
or sales are reported to MLS and these won’t be reflected in the data. “Homes” signifies real-property, single-household
housing units: houses, condos, co-ops, townhouses, duets and TICs (but not mobile homes), as applicable to each market.
City/town names refer specifically to the named cities and towns, unless otherwise delineated. Multi-county metro areas will
be specified as such. Data from sources deemed reliable, but may contain errors and subject to revision. All numbers to be
considered approximate.
Many aspects of value cannot be adequately reflected in median and average statistics: curb appeal, age, condition, amenities,
views, lot size, quality of outdoor space, “bonus” rooms, additional parking, quality of location within the neighborhood, and
so on. How any of these statistics apply to any particular home is unknown without a specific comparative market analysis.
Median Sales Price is that price at which half the properties sold for more and half for less. It may be affected by seasonality,
“unusual” events, or changes in inventory and buying trends, as well as by changes in fair market value. The median sales price
for an area will often conceal an enormous variety of sales prices in the underlying individual sales.
Dollar per Square Foot is based upon the home’s interior living space and does not include garages, unfinished attics and
basements, rooms built without permit, patios, decks or yards (though all those can add value to a home). These figures are
usually derived from appraisals or tax records, but are sometimes unreliable (especially for older homes) or unreported
altogether. The calculation can only be made on those home sales that reported square footage.


