The changes in the housing market dynamics that began in late spring/early summer 2022 generally continued in autumn due to the ongoing economic headwinds, including high inflation and interest rates, reduced consumer confidence, and volatile stock markets, though all have fluctuated significantly over the period, and some readings have recently improved.
The great majority of indicators – home prices and appreciation rates, sales volumes, the overbidding, days-on-market, months supply of inventory, and so on – continue to describe a market that has substantially cooled and “corrected” since spring 2022, when it appears that a long, dramatic, 10- year market upcycle peaked. The correction in San Francisco has been somewhat larger than in other Bay Area counties. (Note that a “correction” is not remotely similar to a crash, such as was seen during the subprime loan/foreclosure crisis.) In recent months, luxury home sales have seen larger year-over-year percentage declines than the general market. But thousands of Bay Area homes continue to sell, some very quickly at over asking price: With the shifts in market conditions, pricing correctly has become an imperative for sellers.
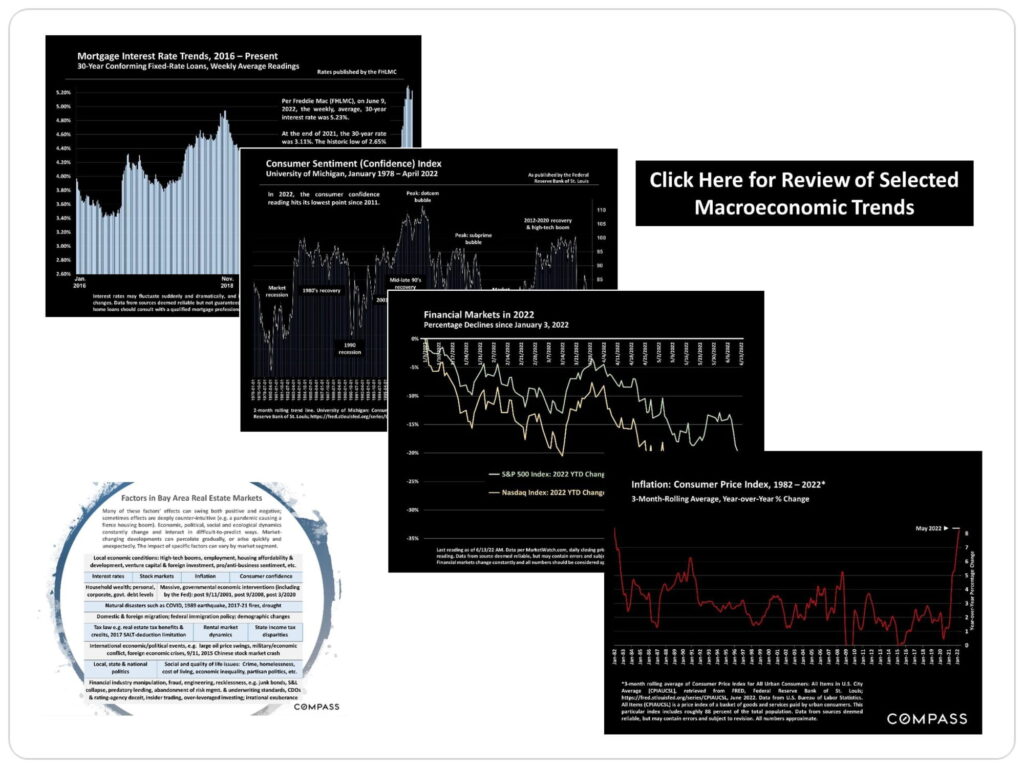
December typically sees the low point of new listing and sales activity – with an increasing number of homes taken off the market to await the new year – but house listing, buying and selling continue. This can be an excellent time for buyers to aggressively negotiate prices, though the supply of listings to choose from declines. The market usually begins to wake up in mid-January and then quickly accelerates in early spring: In the Bay Area, depending on the weather and economic conditions, the “early spring” market can begin as soon as February. The single, most closely watched factor will be interest rates since they have such an outsized impact on monthly housing costs and affordability, as well as on stock markets and consumer confidence. At the end of this report is a link to our extended review of macroeconomic issues.


Statistics are generalities, essentially summaries of widely disparate data generated by dozens, hundreds or thousands of unique, individual sales occurring within different time periods. They are best seen not as precise measurements, but as broad, comparative indicators, with reasonable margins of error. Anomalous fluctuations in statistics are not uncommon, especially in smaller, expensive market segments. Last-period data should be considered estimates that may change with late-reported data. Different analytics programs sometimes define statistics – such as “active listings,” “days on market,” and “months supply of inventory” – differently: what is most meaningful are not specific calculations but the trends they illustrate. Most house listing and sales data derive from the local or regional multi-listing service (MLS) of the area specified in the analysis, but not all listings or sales are reported to MLS and these won’t be reflected in the data. “Homes” signifies real-property, single-household housing units: houses, condos, co-ops, townhouses, duets and TICs (but not mobile homes), as applicable to each market. City/town names refer specifically to the named cities and towns unless otherwise delineated. Multi-county metro areas will be specified as such. Data from sources deemed reliable may contain errors and are subject to revision. All numbers are to be considered approximate.
Many aspects of value cannot be adequately reflected in median and average statistics: curb appeal, age, condition, amenities, views, lot size, quality of outdoor space, “bonus” rooms, additional parking, quality of location within the neighborhood, and so on. How any of these statistics apply to any particular home is unknown without a specific comparative market analysis.
Median Sales Price is the price at which half the properties sold for more and half for less. It may be affected by seasonality, “unusual” events, or changes in inventory and buying trends, as well as by changes in fair market value. The median sales price for an area will often conceal an enormous variety of sales prices in the underlying individual sales.
Dollar per Square Foot is based upon the home’s interior living space and does not include garages, unfinished attics and basements, rooms built without permit, patios, decks or yards (though all those can add value to a home). These figures are usually derived from appraisals or tax records, but are sometimes unreliable (especially for older homes) or unreported altogether. The calculation can only be made on those home sales that reported square footage.