San Francisco Real Estate Market Report – July 2023
Underlying market and economic dynamics in 2023 have been a mixed bag of often contrary and
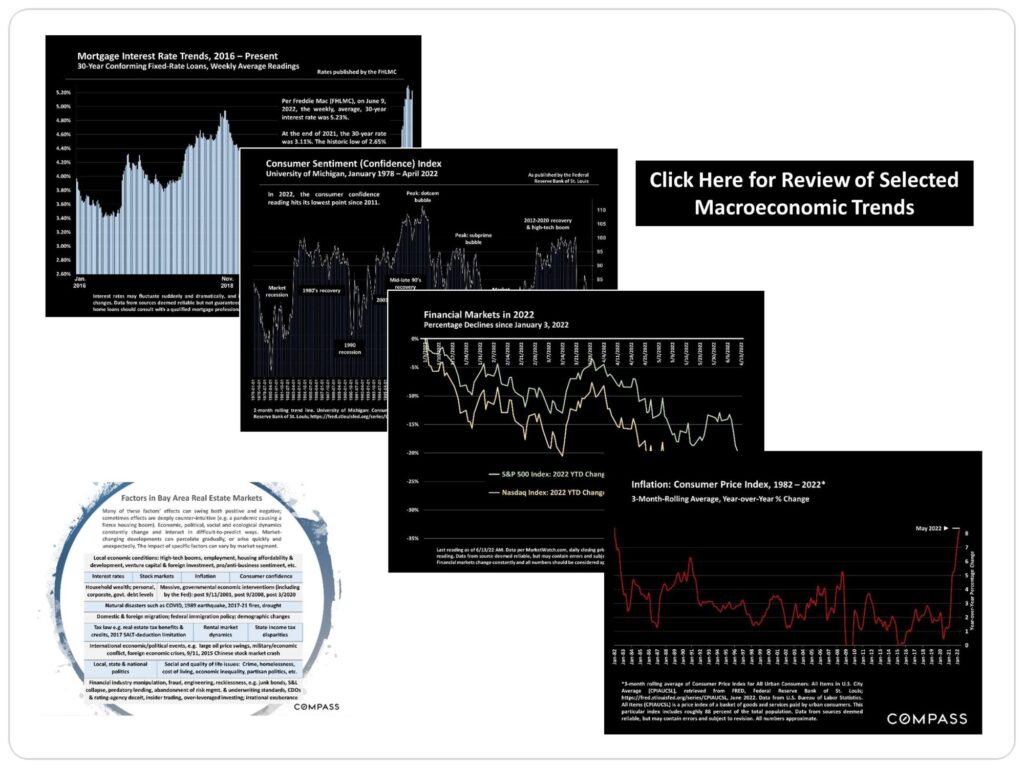
volatile factors – including downward-trending inflation; interest rates bouncing between 6% and
7%; unceasing uncertainty regarding what the Fed will do next; substantial rebounds in stock
markets; bank, commercial real estate and debt-default crises; international political, economic
and military conflicts; high-tech layoffs amid generally strong employment statistics; and a
recovery in buyer demand, sales activity and home prices, but all 3 remaining significantly lower
than the peak of the market in spring 2022. And within the city, market conditions often vary by
property type (houses generally seeing higher demand), neighborhood (the downtown market
remains relatively weak) and/or price segment within types and locations.
Ultimately, the market is defined by neither just demand nor supply, but by the balance between
the two. As we’ve moved deeper into 2023, that balance has generally tilted to sellers’ advantage,
with homes selling faster, with more offers, for higher prices. Part of this is due to seasonal
dynamics: Spring is commonly the highest-demand, most active selling season of the year. But the
contrast with the 2nd half of 2022, when demand and sales plunged, is more than seasonal. It
also reflects a rebound in psychology, with many buyers deciding to move forward with their life plans
For most Bay Area markets, summer has historically been a slower period after spring – with some
regions, such as San Francisco, seeing a relatively short (6 to 8 week) spike up in activity in autumn
before the big midwinter slowdown – but typical seasonal trends have been upended a few times
in recent years. Certainly, a substantial amount of buying and selling will continue to occur in
coming months, as well as variations in underlying economic conditions, which we will cover in
detail in future reports..


")


")


 San Francisco Market Dynamics & Seasonality – Your Home SF3")


Statistics are generalities, essentially summaries of widely disparate data generated by dozens, hundreds or thousands of
unique, individual sales occurring within different time periods. They are best seen not as precise measurements, but as broad,
comparative indicators, with reasonable margins of error. Anomalous fluctuations in statistics are not uncommon, especially in
smaller, expensive market segments. Last period data should be considered estimates that may change with late-reported
data. Different analytics programs sometimes define statistics – such as “active listings,” “days on market,” and “months supply
of inventory” – differently: what is most meaningful are not specific calculations but the trends they illustrate. Most listing and
sales data derives from the local or regional multi-listing service (MLS) of the area specified in the analysis, but not all listings
or sales are reported to MLS and these won’t be reflected in the data. “Homes” signifies real-property, single-household
housing units: houses, condos, co-ops, townhouses, duets and TICs (but not mobile homes), as applicable to each market.
City/town names refer specifically to the named cities and towns, unless otherwise delineated. Multi-county metro areas will
be specified as such. Data from sources deemed reliable, but may contain errors and subject to revision. All numbers to be
considered approximate.
Many aspects of value cannot be adequately reflected in median and average statistics: curb appeal, age, condition, amenities,
views, lot size, quality of outdoor space, “bonus” rooms, additional parking, quality of location within the neighborhood, and
so on. How any of these statistics apply to any particular home is unknown without a specific comparative market analysis.
Median Sales Price is that price at which half the properties sold for more and half for less. It may be affected by seasonality,
“unusual” events, or changes in inventory and buying trends, as well as by changes in fair market value. The median sales price
for an area will often conceal an enormous variety of sales prices in the underlying individual sales.
Dollar per Square Foot is based upon the home’s interior living space and does not include garages, unfinished attics and
basements, rooms built without permit, patios, decks or yards (though all those can add value to a home). These figures are
usually derived from appraisals or tax records, but are sometimes unreliable (especially for older homes) or unreported
altogether. The calculation can only be made on those home sales that reported square footage.
Compass is a real estate broker licensed by the State of California, DRE 01527235. Equal Housing Opportunity. This report has been
prepared solely for information purposes. The information herein is based on or derived from information generally available to the
public and/or from sources believed to be reliable. No representation or warranty can be given with respect to the accuracy or
completeness of the information. Compass disclaims any and all liability relating to this report, including without limitation any express or
implied representations or warranties for statements contained in, and omissions from, the report. Nothing contained herein is intended
to be or should be read as any regulatory, legal, tax, accounting or other advice and Compass does not provide such advice. All
opinions are subject to change without notice. Compass makes no representation regarding the accuracy of any statements regarding
any references to the laws, statutes or regulations of any state are those of the author(s). Past performance is no guarantee of future
results.