San Francisco Real Estate Market Report – July 2021

Excerpts from the report, “Status of the Re-Opening of the san Francisco Economy” issued on June 24, 2021 by the Office of the Controller & the Office of the Economic Analysis of the City & County of San Francisco; Lead authors Ted Egan, Ph.D., Chief Economist & Asim Khan, Ph.D., Senior Economist
- More than 45% of small businesses in SF remain closed (Source: Womply, Opportunity Insights)
- The five-county San Francisco metro area continues to lag comparable metro areas in office attendance, with a weekly office attendance rate below 20%. (Source: Kastle Systems)
- As of Q1 2021, the commercial office vacancy rate remains very high at over 16%. The pre-pandemic average was below 6% (Source: Jones Lang LaSalle)
- At about 35%, the hotel occupancy rate, though recovering, remains well below the pre-pandemic average, which was close to 80% (Source: STR
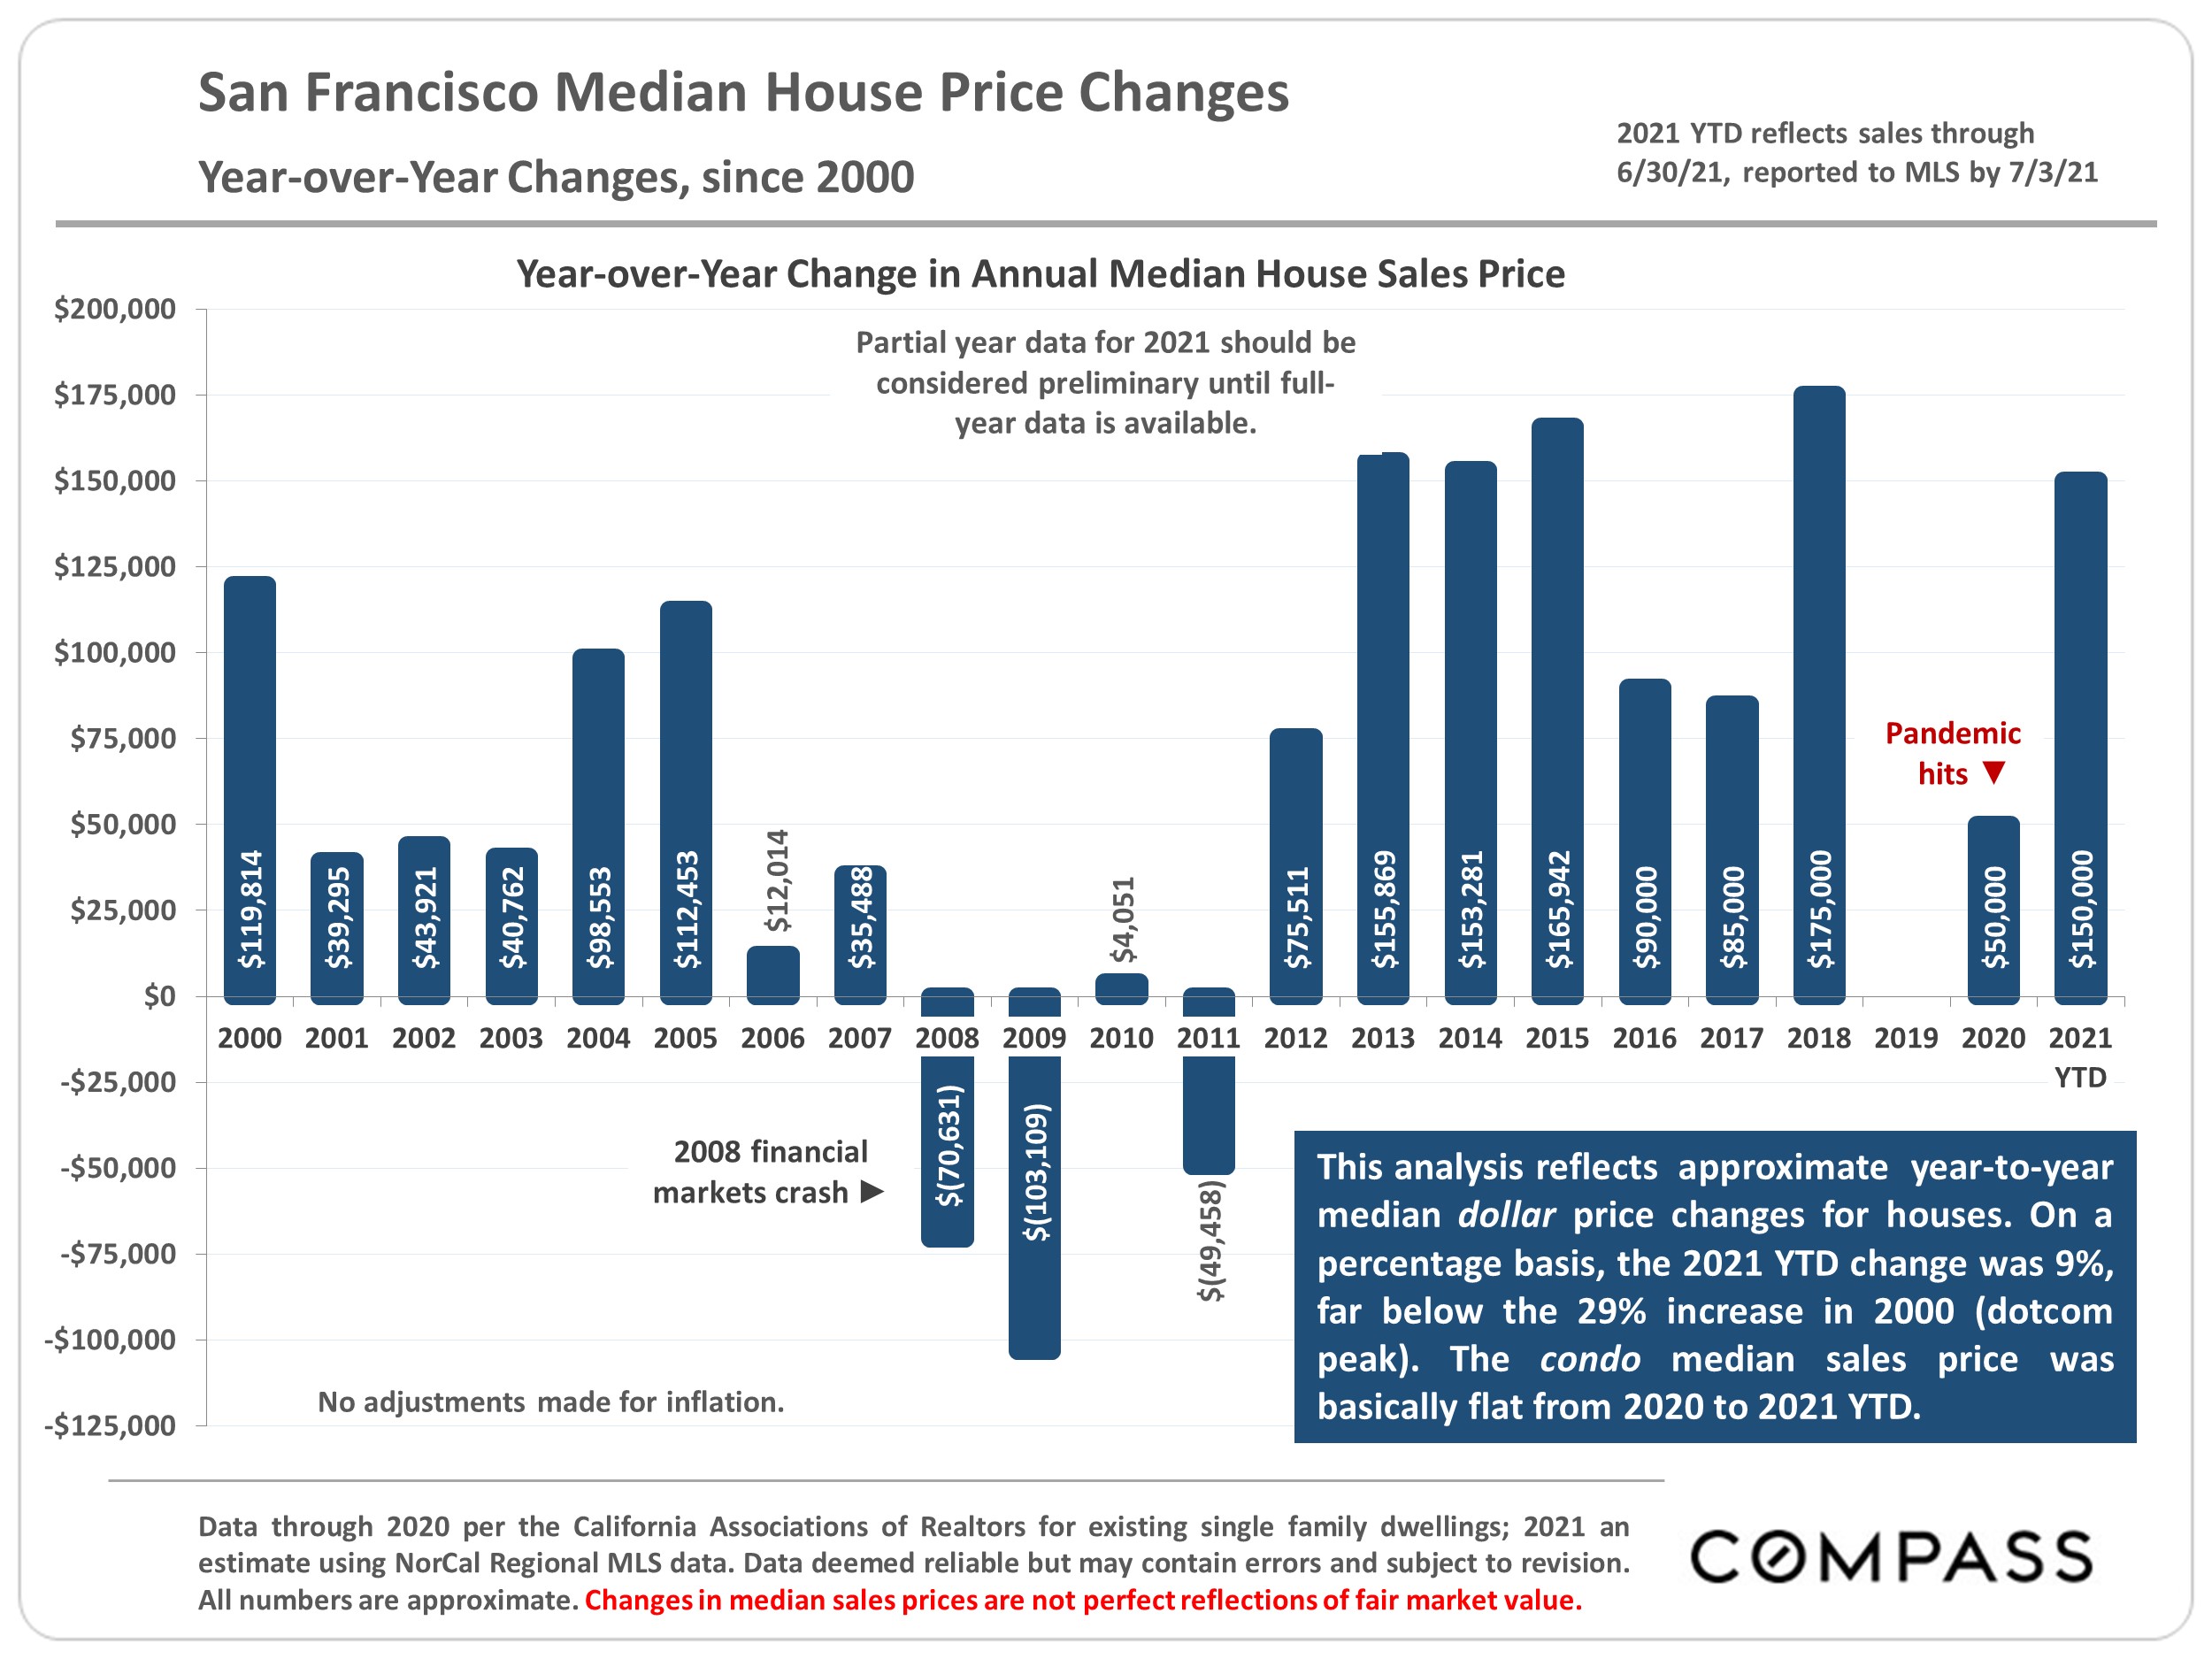
- Employment in the San Francisco Metro Division is recovering slowly. Total employment is still down 10% from its pre-pandemic level. The unemployment rate has declined from over 12% at the start of the pandemic, to 5.1% in May of this year. The pre-pandemic rate was just over 2%. (Source: CA Employment Development Department)
- Evening freeway speeds in downtown have dropped, indicating the return of traffic congestion. However, BART ridership to downtown San Francisco stations was 12% of normal in May. (Sources: San Francisco County Transportation Authority, BART)
- Travel at SF International Airport, though recovering, is still almost 70% down from 2019. (Source: San Francisco International Airport)
- There are clear signs of recovery in apartment rents in San Francisco. However, average asking rents remain approximately 19% below pre-pandemic rates. (Source: ApartmentList)
- The number of building permits for new housing are well below 2019 levels. (Source: HUD)
The full report can be downloaded here.
These excerpts were compiled and edited in good faith, but may contain errors and subject to revision. Readers are encouraged to review the complete report, which also includes other statistics and insights.
