San Francisco Real Estate
|
House & Condo Market Dynamics
|
SF house and condo markets have been affected differently by the pandemic. This report attempts a deeper dive into the data across the city and within different city districts.
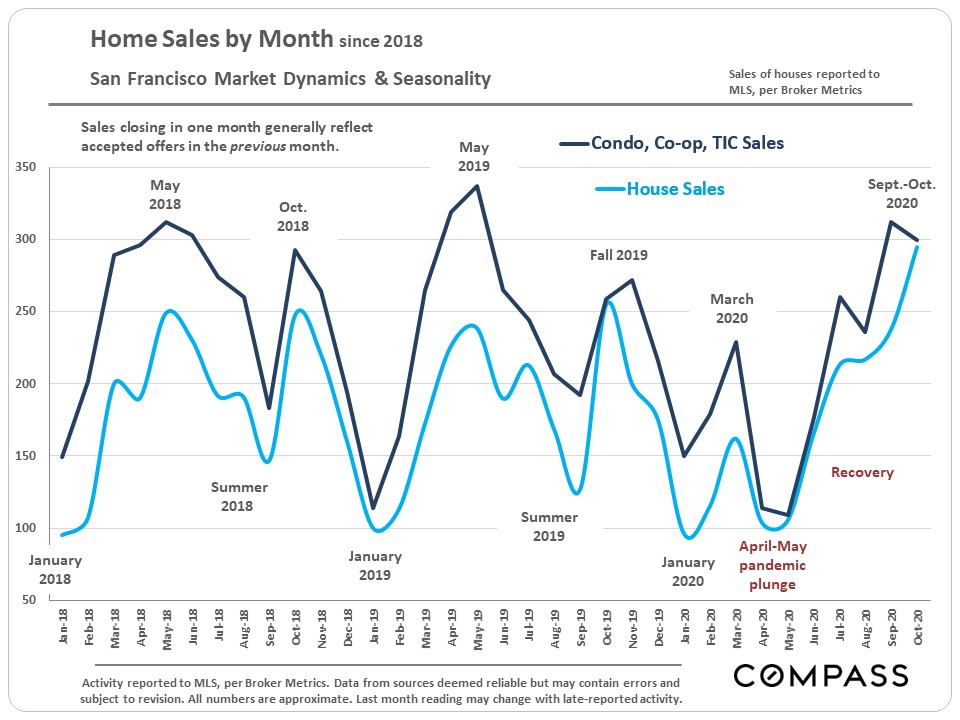
The market typically starts a big slowdown in mid-November, running through the mid-winter holidays, until it begins to wake up in mid-January. High-price segments normally see the most dramatic plunges in mid-winter activity.
This year, the pandemic upended seasonality: Spring, usually the strongest selling season, saw a crash in activity; summer, which typically slows down – especially for luxury home sales – saw high demand; and the summer market accelerated into autumn. But supply has been accelerating even faster than demand.
We suspect late Q4 will see something of a slowdown, but remain more active than in past years.
|
General City Dynamics, House & Condo
|
Sales rebounded strongly from the early-spring pandemic crash: House sales are higher than in recent years and condo, co-op and TIC sales are at levels comparable to peak sales volumes over that period.
|
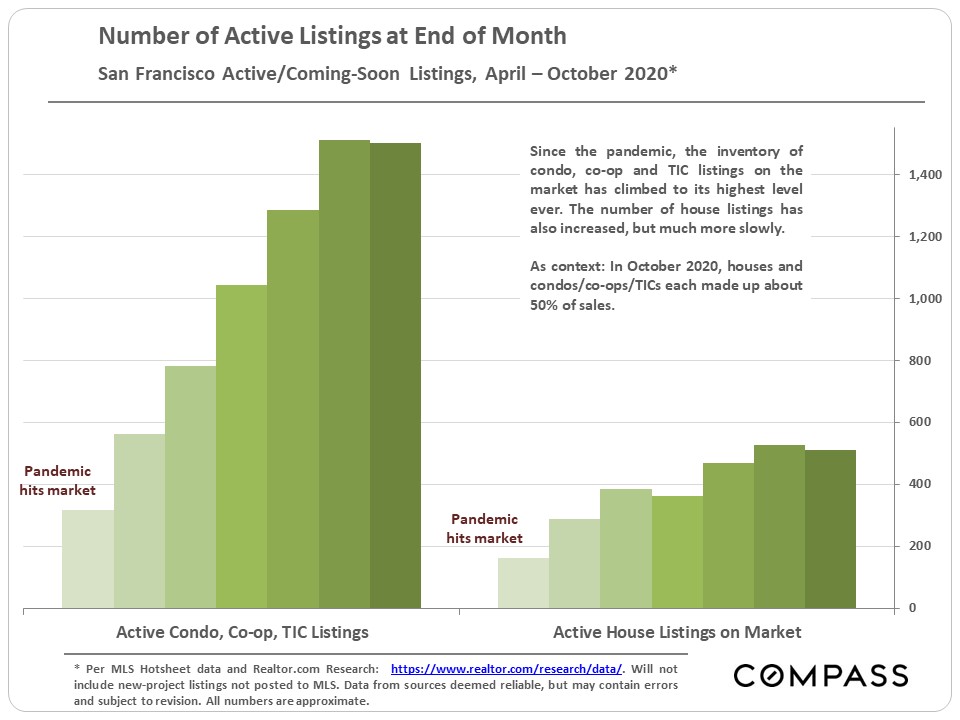
The most dramatic change is the increase in the number of listings for sale. Condo, co-op and TIC listings in MLS are at their highest point ever, approximately 85% higher than one year ago. House listings are also up, but much less dramatically, running about 20% to 25% higher than in autumn 2019.
|
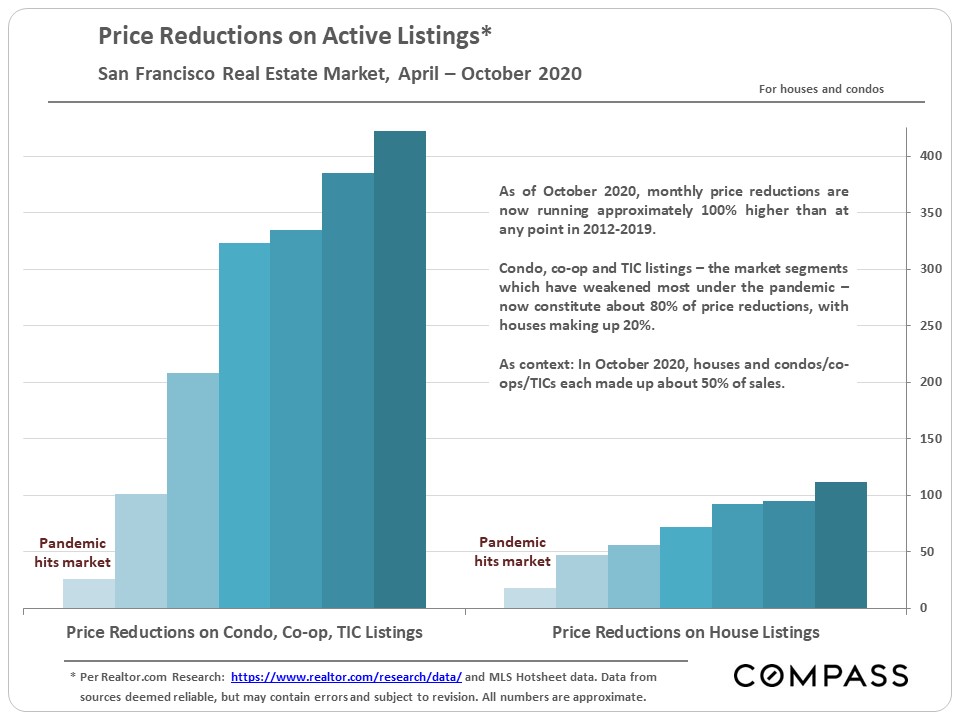
Steady demand but soaring inventory has led to an increase in price reductions. When demand outweighs supply, buyers compete for listings, usually by overbidding. When supply outweighs demand, sellers often compete for buyers through price reductions. The condo market is probably seeing its highest number of reductions in history.
|
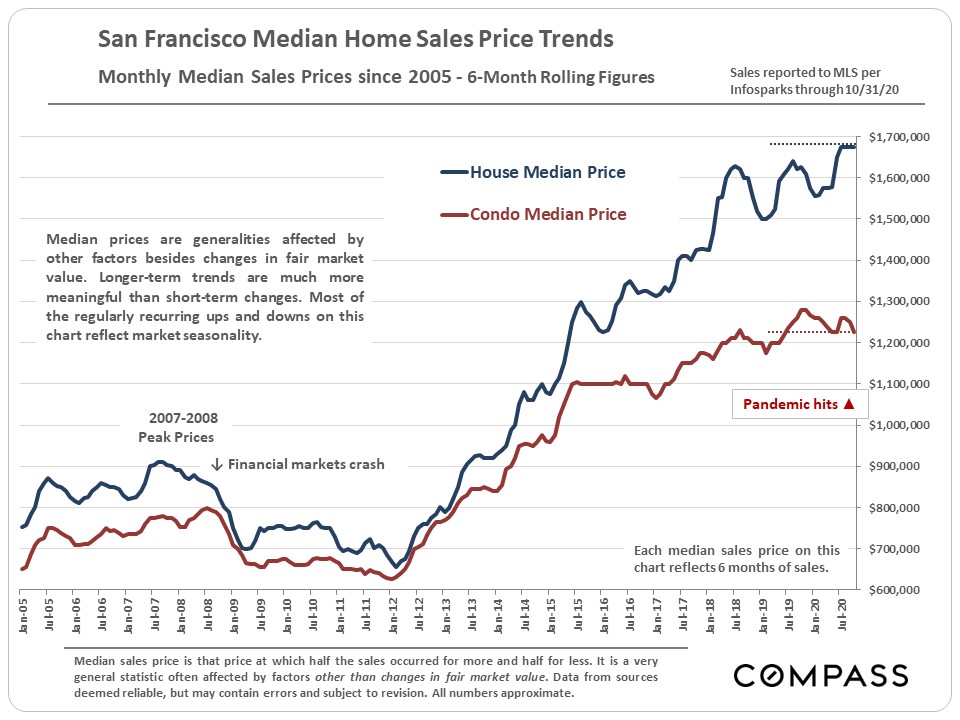
Long-term median sales price trends, 6-month rolling:
|
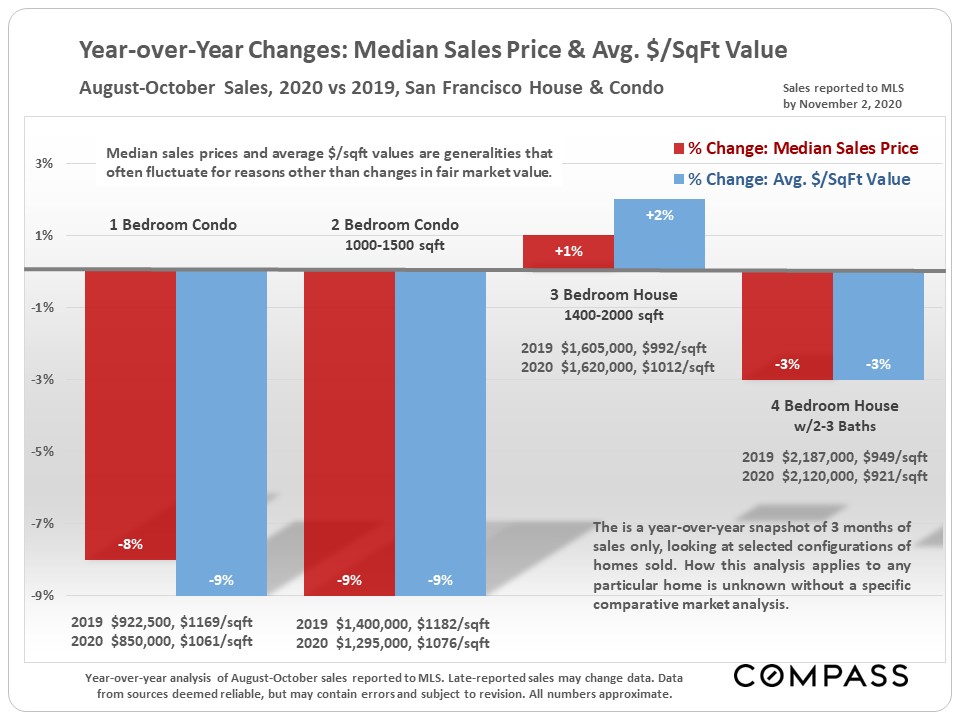
Year-over-year changes in median sales prices and average dollar per square foot values in selected home configurations. The condo market has been hit by significant declines in these 2 measurements.
|
Luxury Home Sales by Property Type & Price Segment
|
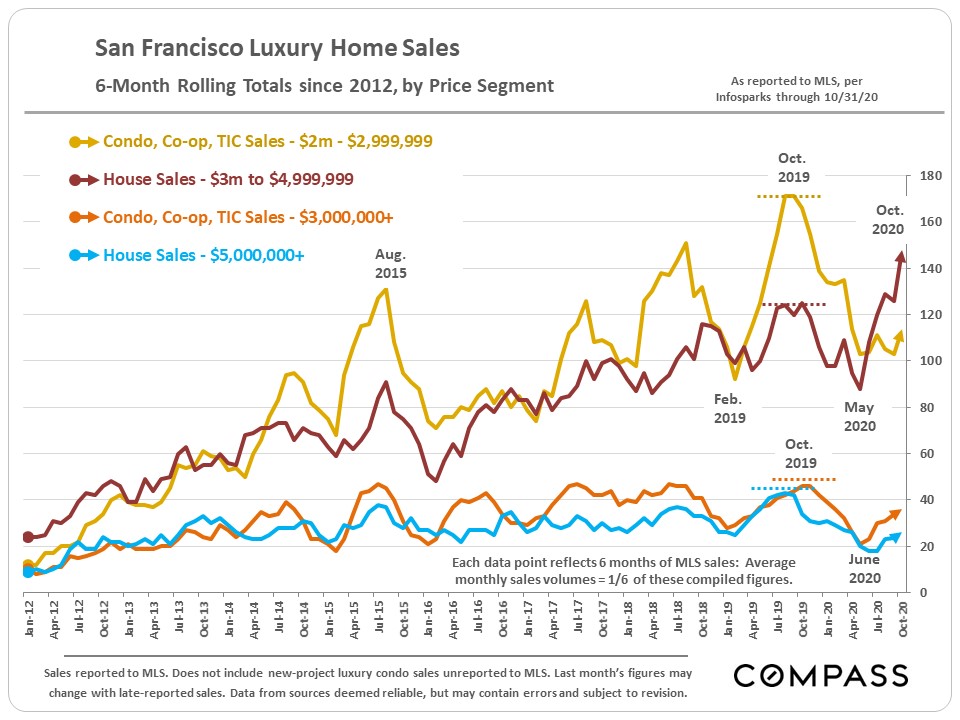
Of the luxury home segments broken out in the chart below, the market for houses selling for $3,000,000 to $4,999,999 (red line) has rebounded very strongly over the past 6 months, hitting a new peak in sales (on a 6-month rolling basis). The other segments – luxury condos and co-ops, and $5m+ houses – have seen much smaller rebounds from shelter-in-place lows, and remain far below previous peaks.
|
House Markets by District/Neighborhood
|
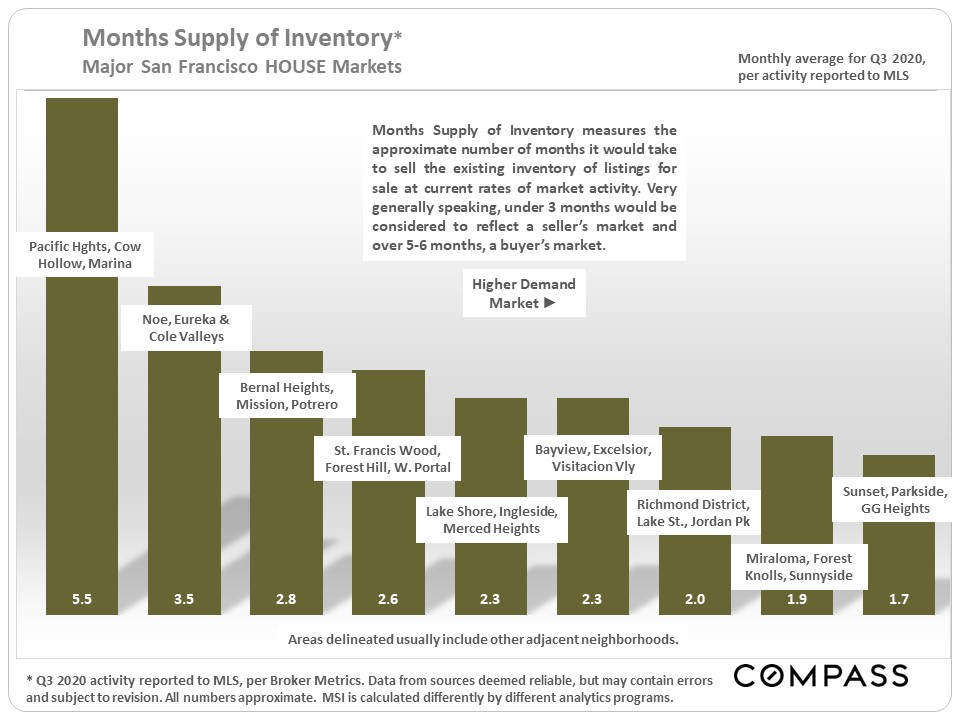
Within the city, there are significant differences in market dynamics by location. This report will look first at house markets, followed by a series of analyses on condo markets. How these charts apply to any particular home is unknown without a specific comparative market analysis.
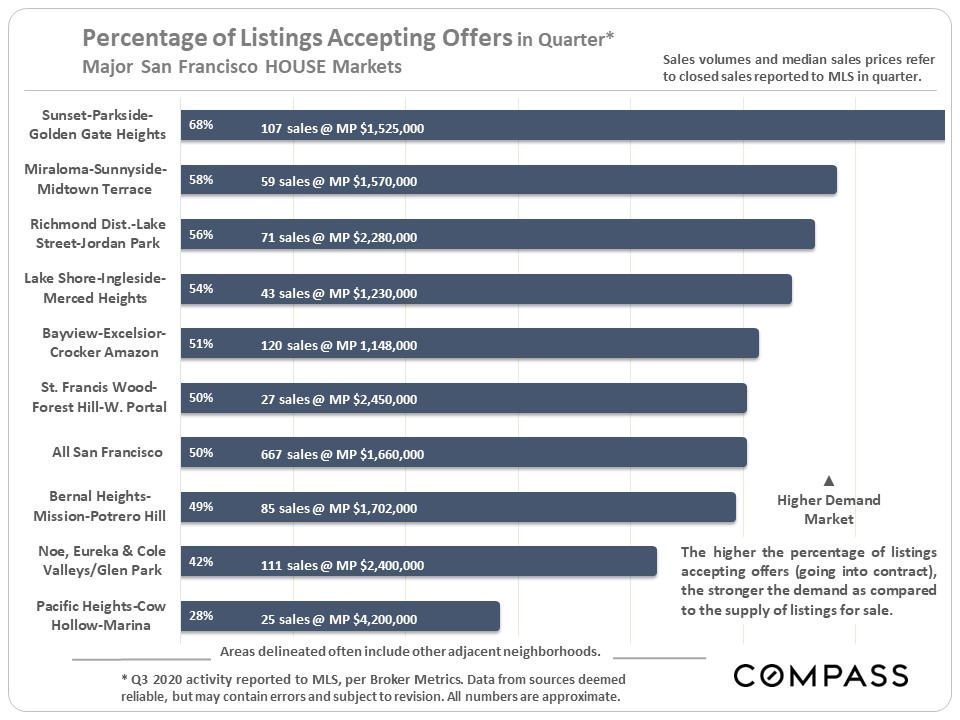
By most standard measurements, the greater Sunset/Parkside district has the strongest house market in the city with house values just below the SF median house price. At the softer end of dynamics are 2 of the city’s most expensive districts, which feature the largest luxury house segments.
|
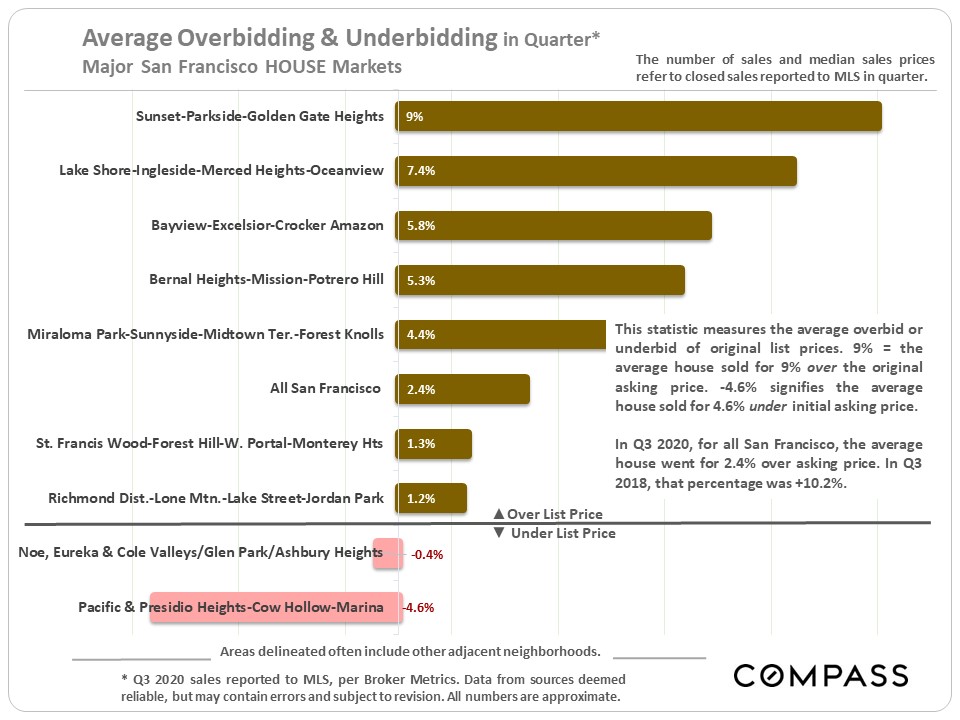
Overbidding on house listings is well down from the crazed levels of recent years, but is still relatively common in more affordable districts. Some part of the overbidding percentages is caused by strategic underpricing of listings (to get buyers excited).
|
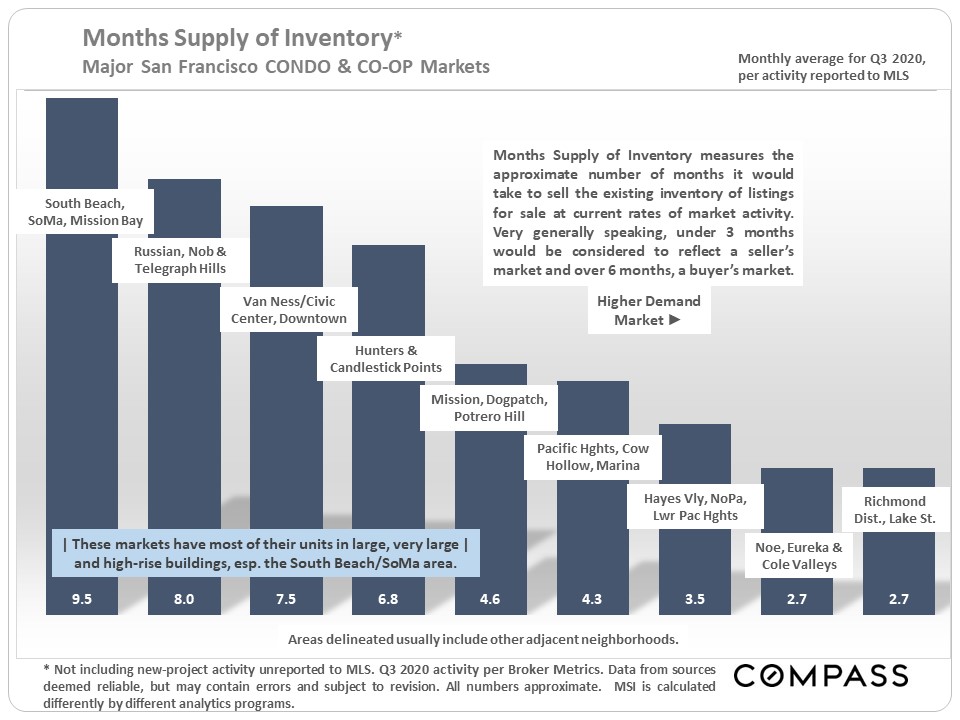
San Francisco Condo Markets by District/Neighborhood
|
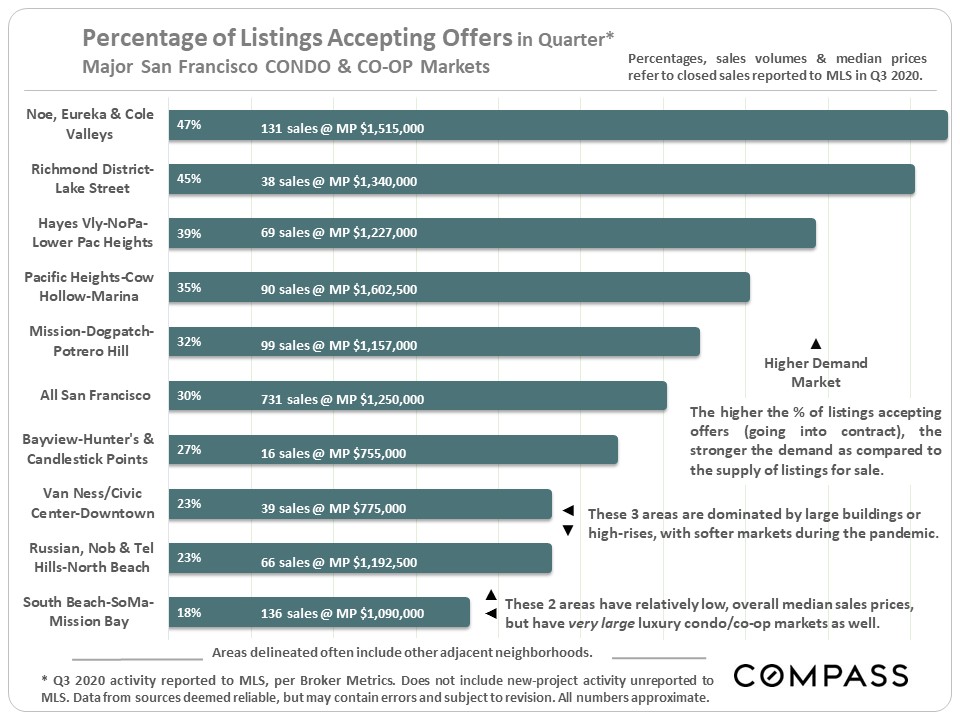
Since the pandemic hit, the softest condo markets have been those dominated by larger complexes and high-rises. The greater South Beach/ SoMa/ Mission Bay area – by far the largest condo market in SF – has the weakest supply and demand dynamic, followed by the greater Russian, Nob and Telegraph Hills area, and the Van Ness/Civic Center area.
Markets dominated by smaller buildings, often with separate unit entrances and dedicated outdoor spaces, have seen stronger buyer demand.
|
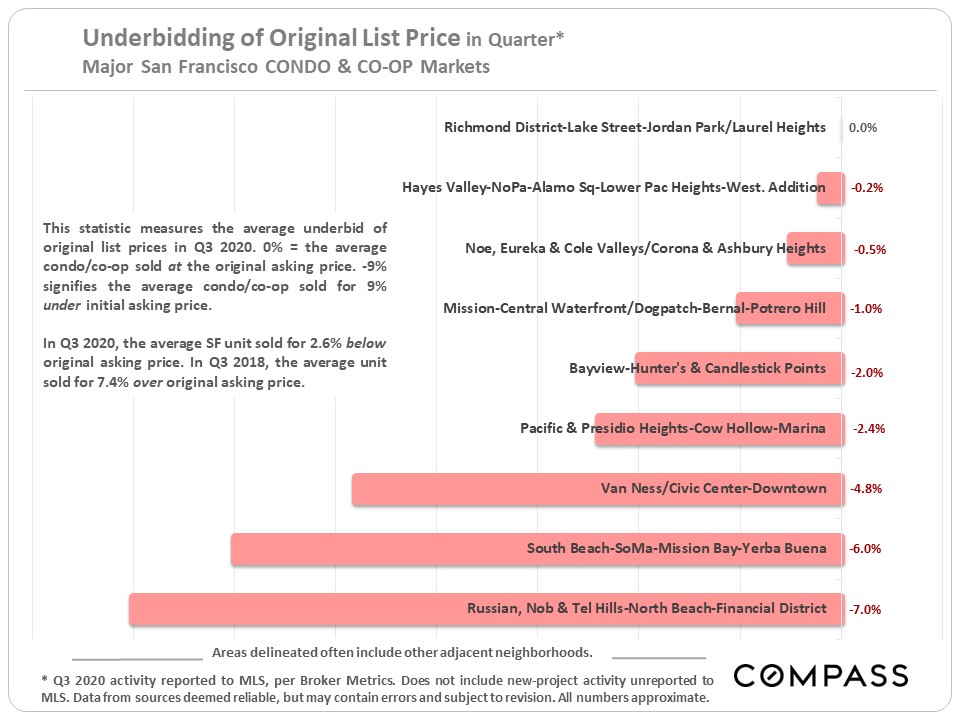
As a statistical average, overbidding above the original list price has disappeared from the condo market. This ties in with the previous chart on price reductions.
|
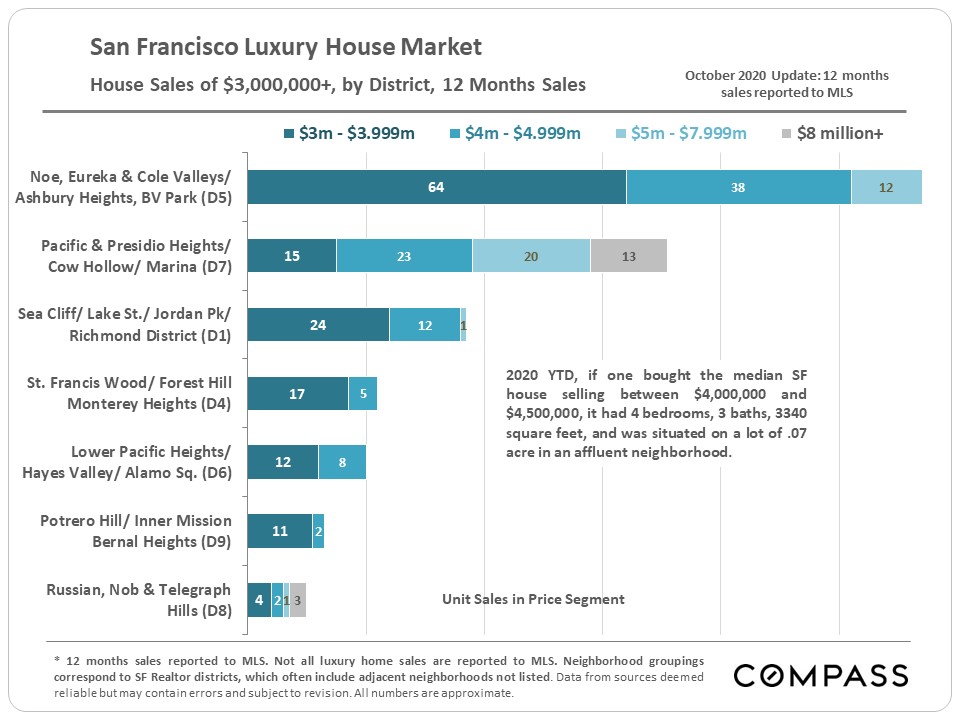
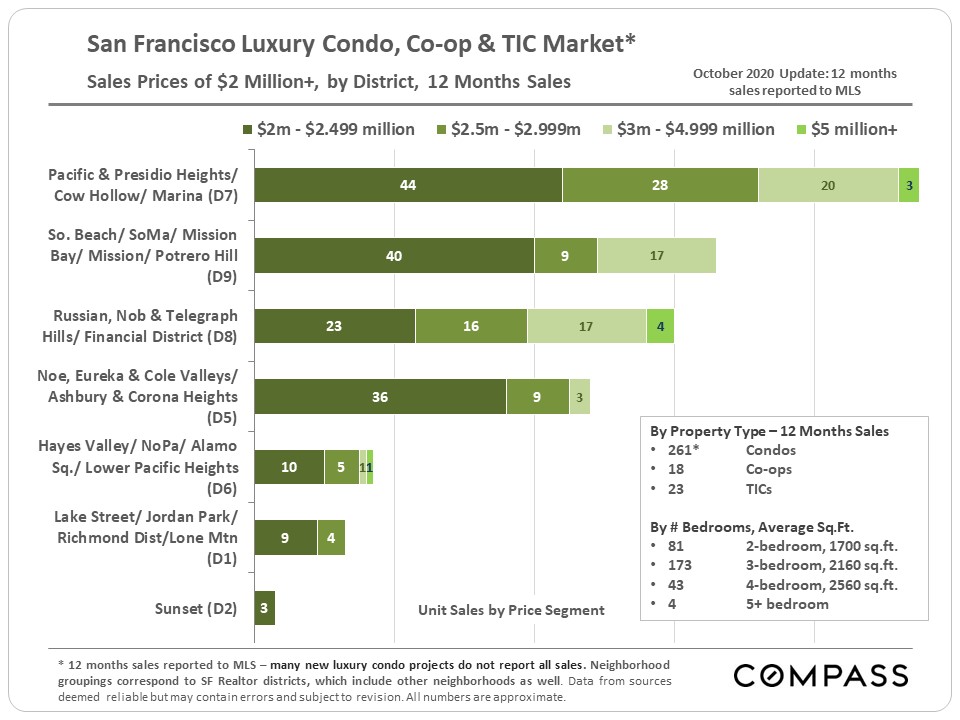
A breakdown of luxury condo, co-op and TIC sales – $2 million and above – by district.
|
|
© Compass 2020 ¦ All Rights Reserved by Compass ¦ Made in NYC
Compass is a real estate broker licensed by the State of California operating under
multiple entities. License Numbers 01991628, 1527235, 1527365, 1356742, 1443761, 1997075,
1935359, 1961027, 1842987, 1869607, 1866771, 1527205, 1079009, 1272467. All material presented
herein is intended for informational purposes only and is compiled from sources deemed reliable
but has not been verified. Changes in price, condition, sale or withdrawal may be made without
notice. No statement is made as to accuracy of any description. All measurements and square
footage are approximate. Equal Housing Opportunity.
marketingcenter-sfbayarea-sfcityproper
|
|
|